
Analyzing Failed Betting Systems Using Historical UK Data
Reading time
~25 minutes
Difficulty level
Intermediate — assumes basic familiarity with betting terminology
What you'll walk away with
A complete framework for betting on UK horse racing: value identification, form reading, bankroll sizing, exchange trading, and a pre-bet checklist you can use today
I spent my first two years betting on horse racing convinced I was one system tweak away from cracking the code. I tracked trainers, studied going reports, followed tipsters who promised 30% ROI. My spreadsheet grew to over a thousand rows. My bank balance shrank. The turning point came when I stopped looking for shortcuts and started looking at what the numbers actually said about the people who win — and, more importantly, about why everyone else loses.
Here's the uncomfortable truth: only 2-3% of sports bettors sustain a profit over the long term. That's not a figure plucked from a tipster's sales page — it's the consistent finding across industry analyses year after year. The professionals who do make it work aren't hitting 70% winners or finding secret angles nobody else has noticed. They're typically landing 52-55% of their bets and grinding out an edge through discipline, value identification, and bankroll control. The gap between them and everyone else isn't talent. It's method.
This guide is built from eight years of analysing UK racing data. Every claim is backed by figures from the Gambling Commission, the British Horseracing Authority, the Horserace Betting Levy Board, or peer-reviewed research. I'm not going to tell you which horse to back on Saturday — I'm going to show you how to think about every race you'll ever bet on.
If you're looking for a magic formula, close the tab. If you want a framework built on evidence and tested against real UK racing data, keep reading.
The Data-Driven Punter's Cheat Sheet
- Only 2-3% of bettors profit long-term — the edge comes from value betting (positive expected value), not from picking more winners. Professionals typically hit just 52-55% of their bets.
- The bookmaker's overround (15-20% on standard UK races) is a structural headwind. Exchange markets at 101-105% overround give you a materially better starting position.
- Favourites win roughly 34.4% of all UK races — dropping to 25.7% in handicaps. These baselines are essential for any probability estimate.
- Bankroll management isn't optional: a 100-unit bank with 1-unit flat stakes survives the losing runs that wipe out undisciplined bettors.
- Regulatory shifts — affordability checks and a 522% rise in unlicensed site traffic — are reshaping where and how UK punters can bet. Diversify your licensed accounts.
The UK Horse Racing Betting Market in Numbers
A few years ago, I sat next to a semi-professional punter at Cheltenham who told me he didn't need to know anything about the market — "just the horses." He was wrong, and his P&L showed it. You're not betting in a vacuum. You're betting inside a machine with specific economics, and those economics tilt the game against you in ways that are worth understanding before you place a single wager.
Online horse racing betting generated £766.7 million in gross gambling yield in the year to March 2025, making racing the second-largest sport for UK online betting behind football's £1.3 billion.
The total UK gambling market hit £16.8 billion in gross gambling yield for the year ending March 2025 — a 7.3% jump year on year. Online casino, sports betting, and bingo alone account for £7.8 billion, growing at 13.1%. Racing sits in the middle of this ecosystem, competing for attention against football accumulators, casino slots, and a dozen other verticals.
But the headline figures mask a problem. Total betting turnover on horse racing fell 4.3% in 2025, and the cumulative decline from 2023 stands at 10.3%. Anne Lambert, the Interim Chair of the Horserace Betting Levy Board, put it plainly: "Racing is facing significant challenges." The number of horses in training dropped to 21,728 in 2025 — down 2.3% on the previous year — and average field sizes have contracted, with Flat meetings averaging 8.90 runners and Jumps meetings just 7.84.
The market is polarising. Premier fixtures — Cheltenham, Royal Ascot, the Grand National meeting — saw average betting turnover per race rise 2.7%, while Core fixtures suffered an 8.6% decline. For selective bettors, this polarisation works in your favour: bigger fields, deeper markets, and sharper prices cluster around flagship events.
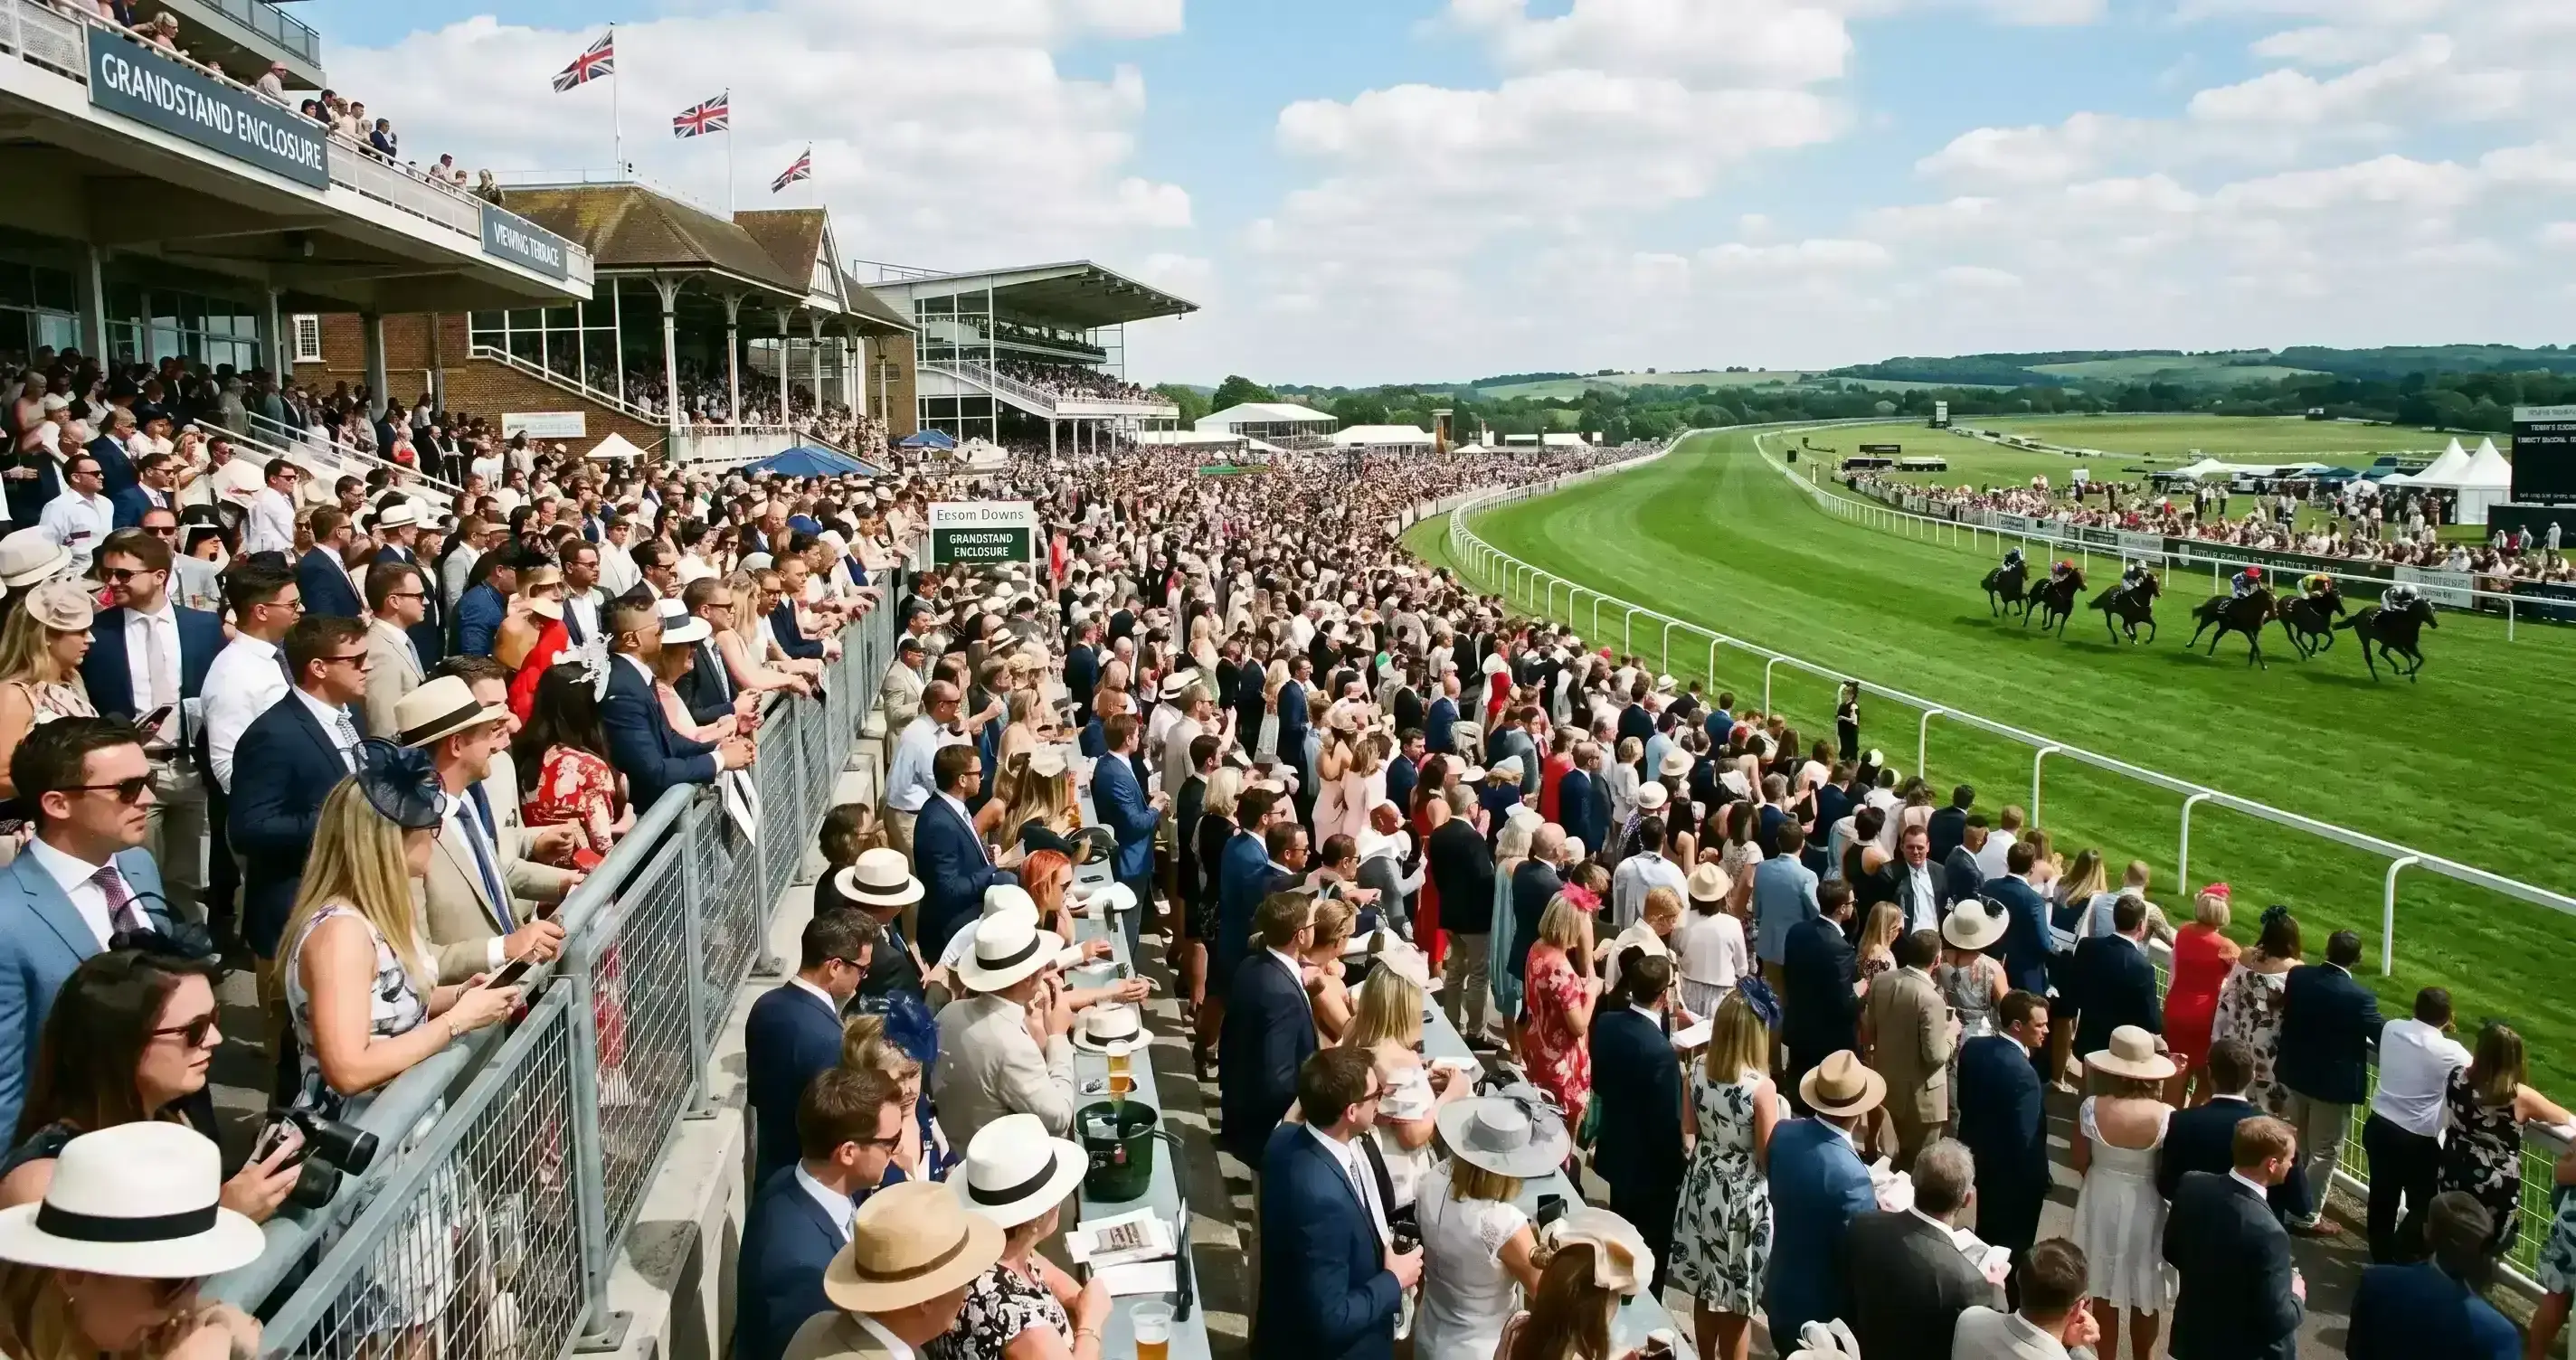
Around 24.4 million active online gambling accounts exist in the UK, with roughly 15% of adults betting on racing at least once a month. Most of that money comes from recreational punters betting for entertainment — and that recreational flow is precisely what creates the inefficiencies an analytical bettor can exploit.
Understanding the market's size and pressures is the first step. The next is understanding the mechanism that ensures most of that money flows one way — towards the bookmaker. That mechanism has a name: the overround.
Dutching Matrix
How Odds Work: Implied Probability and the Bookmaker's Edge
I once watched a friend bet on three horses in the same race at 3/1, 4/1, and 5/1, convinced he was "covering his bases." He hadn't done the maths. His three bets implied a combined 108% chance of one winning — mathematically impossible, and a guaranteed path to overpaying. This mistake disappears the moment you understand what odds actually represent.
Implied probability — the percentage chance of an outcome that a set of odds represents. Fractional odds of 4/1 imply a 20% chance (1 divided by 5). Decimal odds of 5.00 imply the same (1 divided by 5.00 = 0.20). Converting odds to probabilities is the single most important arithmetic skill in betting.
Overround — the amount by which the implied probabilities of all runners in a race exceed 100%. A 120% book means the bookmaker has built in a 20% margin. Also called "vig" or "juice." It's the house edge, baked into every market you'll ever bet into.
Let me walk through a concrete example. The horses and odds below are illustrative — they don't represent a real race — but the arithmetic works exactly the same way on any race card you'll encounter. Take a six-runner race where the bookmaker's prices are:
| Horse | Fractional Odds | Decimal Odds | Implied Probability |
|---|---|---|---|
| A | 2/1 | 3.00 | 33.3% |
| B | 3/1 | 4.00 | 25.0% |
| C | 5/1 | 6.00 | 16.7% |
| D | 6/1 | 7.00 | 14.3% |
| E | 10/1 | 11.00 | 9.1% |
| F | 14/1 | 15.00 | 6.7% |
| Total implied probability | 105.1% | ||
That extra 5.1% above 100% is the overround — the bookmaker's built-in margin. Every pound you bet is effectively reduced by that margin before the race even starts. And 5.1% is a generous example. The typical overround on UK horse racing sits between 15% and 20% for standard meetings, climbing above 25% for smaller fixtures with thinner markets.
Calculating overround from any set of odds
Step 1: Convert each horse's fractional odds to implied probability. For fractional odds of a/b, the formula is: b / (a + b). So 3/1 becomes 1 / (3 + 1) = 0.25, or 25%.
Step 2: Sum all the implied probabilities. In our six-runner example: 33.3 + 25.0 + 16.7 + 14.3 + 9.1 + 6.7 = 105.1%.
Step 3: Subtract 100. The result — 5.1% — is the overround. The higher this number, the worse the value on offer.
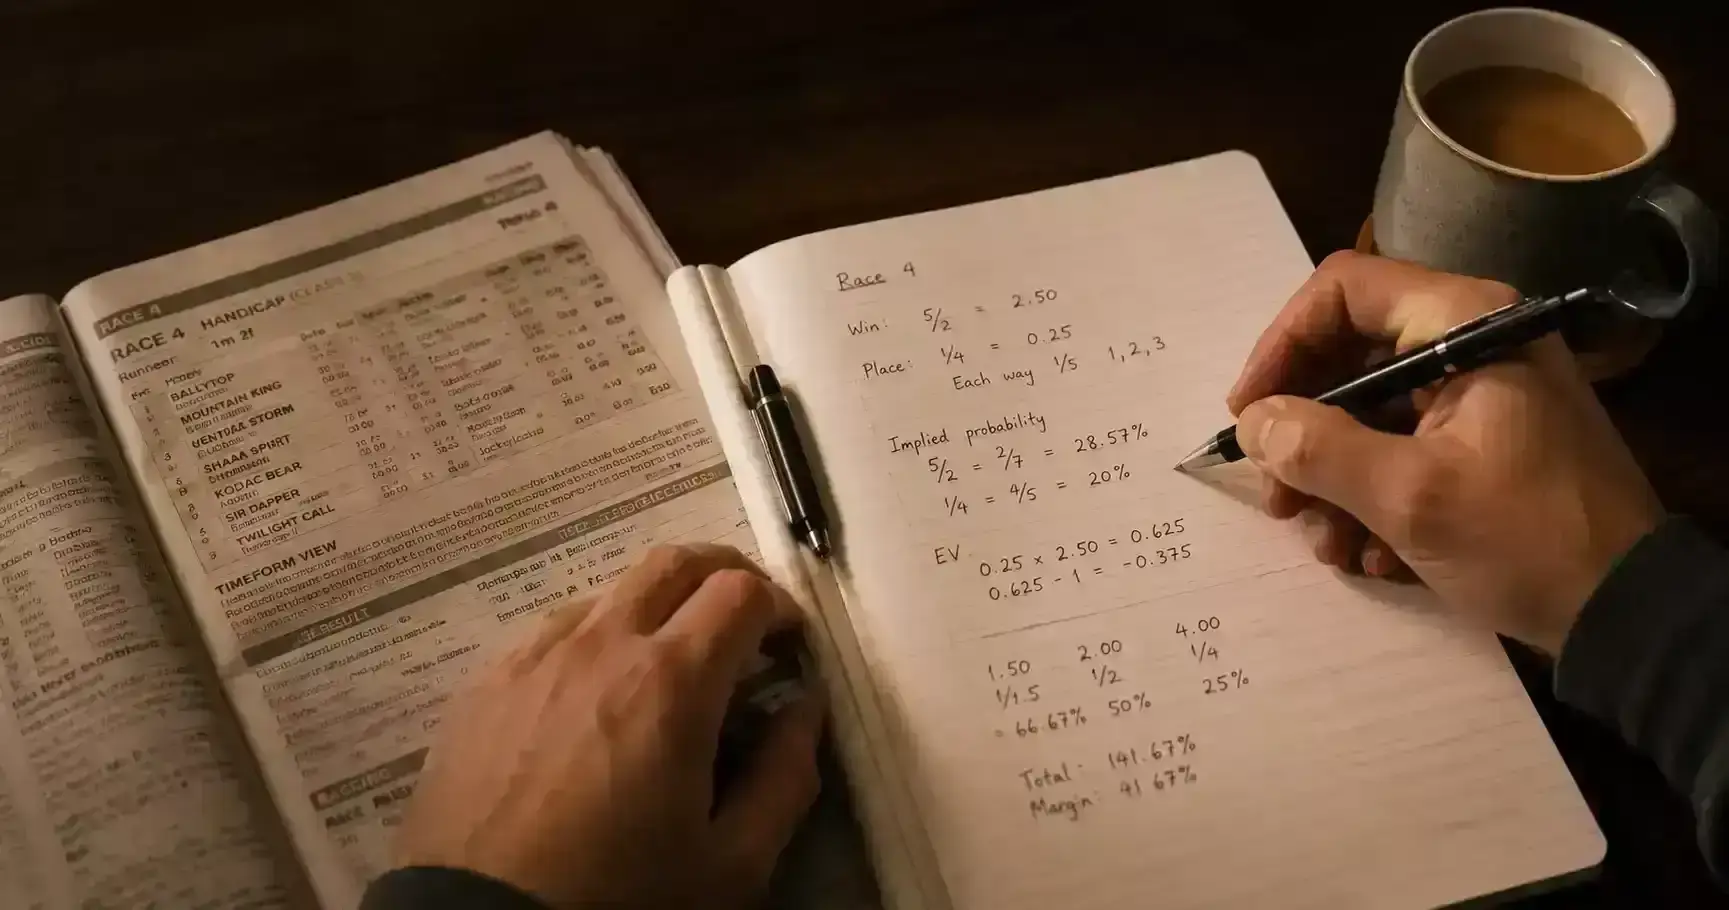
UK bookmaker overrounds peaked at around 28% in 2001 and have fallen steadily since, driven by competition between bookmakers and from betting exchanges. But even at today's typical 20%, you're starting every race with a significant headwind. The overround is the reason that simply picking winners isn't enough. You need to pick winners at prices that compensate for the margin built into every market.
Tissue pricing — a bookmaker's preliminary set of odds for a race, compiled before the market opens. Tissues reflect the bookmaker's initial estimate of each horse's chances. Understanding that the tissue is an estimate, not a fact, is the foundation of value betting.
Value Betting: Finding Odds the Bookmaker Got Wrong
Three years into my betting career, I backed a 10/1 shot that won by six lengths and felt like a genius. The next week I backed another 10/1 shot on the same logic and it trailed in last. Only when I sat down with a calculator did I realise the first bet had been brilliant and the second had been terrible — not because of the result, but because of the price relative to the horse's actual chance. That distinction is everything.
Value betting is the only sustainable edge in horse racing. It doesn't mean picking winners — it means identifying bets where the odds on offer are higher than the true probability of the outcome. Every other strategy in this guide is, ultimately, a way of finding or maximising value.
The concept is simple. A value bet exists when you assess a horse's true chance of winning at, say, 25%, but the bookmaker is offering odds that imply only a 20% chance — meaning you're getting 4/1 on something you believe is closer to 3/1. Over hundreds of bets, consistently finding these discrepancies is what turns a losing habit into a profitable method.
Expected Value calculation for a single bet
Suppose you estimate a horse has a 30% chance of winning. The bookmaker offers 4/1 (decimal 5.00). Your stake is £10.
EV = (Probability of winning x Net profit if win) - (Probability of losing x Stake)
EV = (0.30 x £40) - (0.70 x £10)
EV = £12.00 - £7.00 = +£5.00
A positive EV of £5 means that, on average, every time you make this bet you expect to profit £5. This single bet might lose — the horse only wins 30% of the time — but the price more than compensates for the risk.
Now change the odds to 2/1 (decimal 3.00) with the same 30% probability:
EV = (0.30 x £20) - (0.70 x £10) = £6.00 - £7.00 = -£1.00
Same horse, same assessment — but now it's a bad bet. The price doesn't compensate for the risk.
The hard part, obviously, is estimating the true probability. Favourites win roughly 34.4% of all UK races — a useful baseline, but far too blunt for practical use. In handicaps, that figure drops to around 25.7%, while in non-handicaps it climbs to about 39%. These splits tell you something immediately: the type of race changes the probability landscape, and any value assessment that ignores race type is working with broken inputs.
I estimate true probabilities by combining recent form, speed ratings, going preferences, trainer/jockey strike rates at the specific course, and draw data for flat races. No single factor is reliable alone. My rule: if I can't articulate why a horse's true chance differs from the market's implied probability, I don't bet.
For a deeper dive into the EV formula, implied probability conversion, and practical methods for spotting mispriced odds in UK markets, I've written a dedicated guide to horse racing value betting that walks through every step with worked examples.
Value betting tells you which bets to take. But to estimate true probabilities, you need raw material — and the richest source of that material is the race card. Let's talk about form analysis.
Form Analysis: Reading the Race Card Like a Professional
The first time I opened a Racing Post race card, it looked like someone had encrypted a spreadsheet. Numbers, dashes, letters, abbreviations — a wall of data designed, it seemed, to intimidate newcomers. Six months later, I couldn't imagine betting without it. The race card is the single richest source of structured information available to any punter, and learning to read it properly is the skill that separates analysis from guesswork.
Free race cards are available on the Racing Post website, the At The Races site, and through most bookmaker apps. Paid services like Timeform and Racing Post Members' Club add proprietary speed ratings and analyst comments. Start with the free versions — they contain everything you need for competent form analysis.
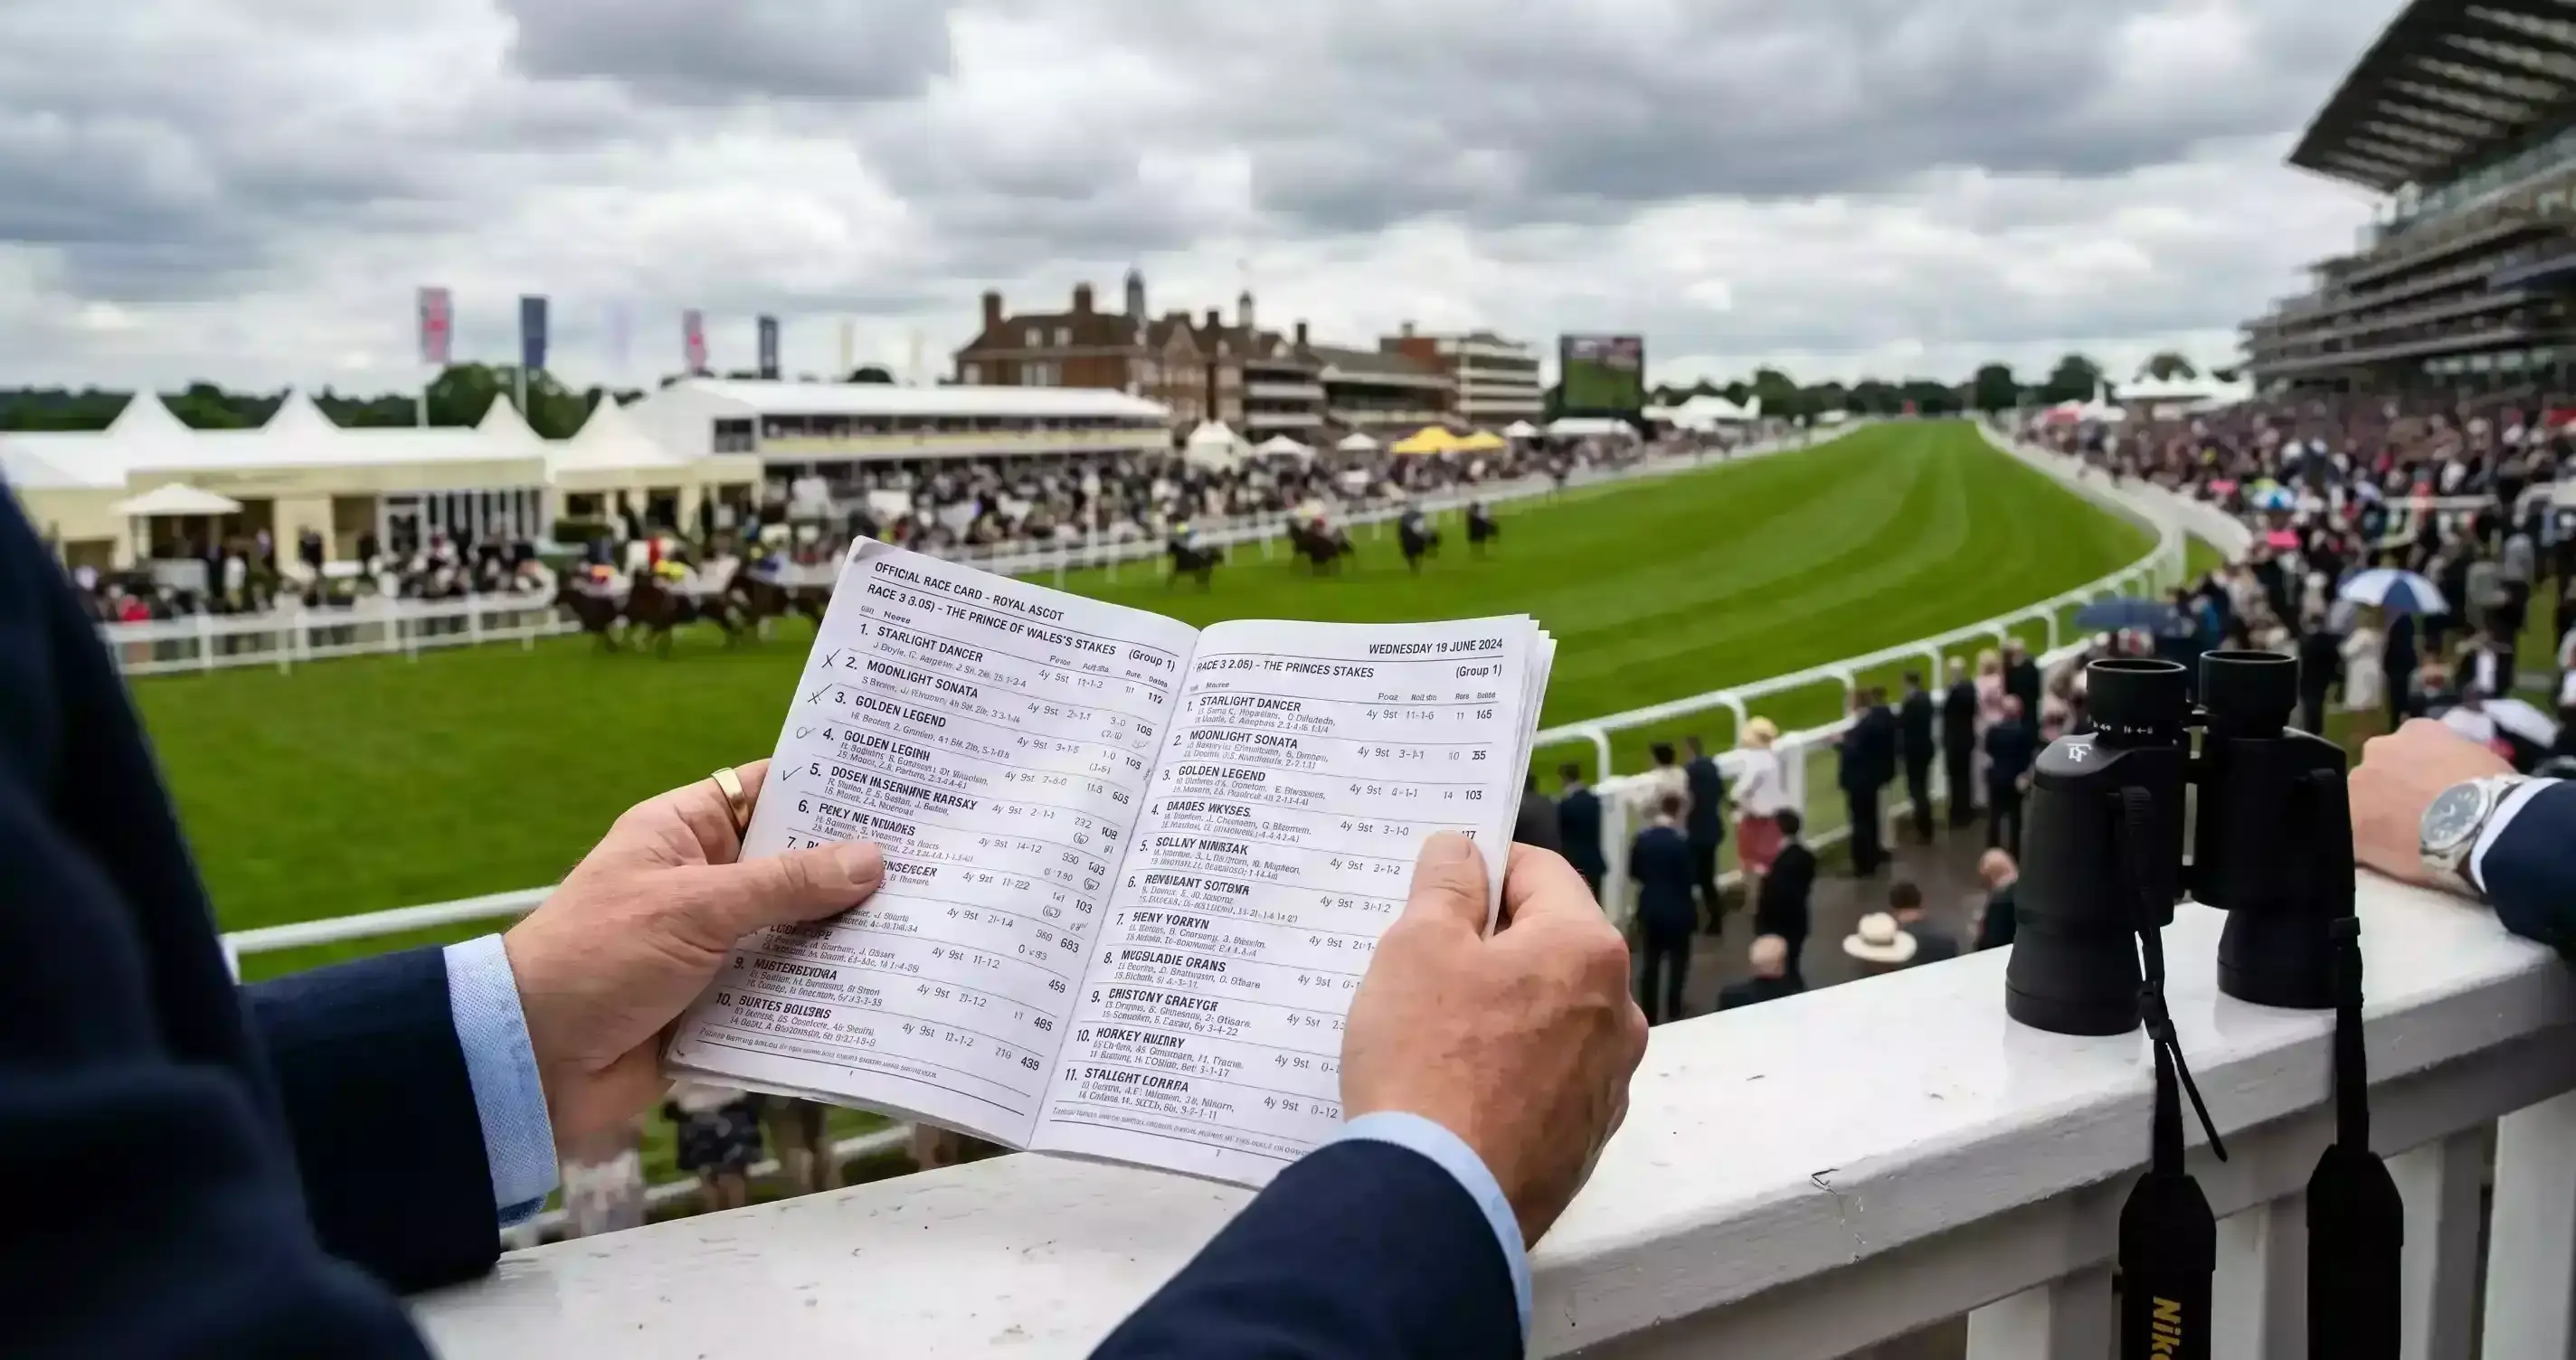
Every horse's recent results appear as a string of figures: "1" for a win, "2" for second, "0" for finishing tenth or worse, and so on. The most recent run sits on the right, so "321" means the horse finished third, then second, then won — an improving profile. A "C" or "D" indicates the horse's performance at the current course or distance. These symbols compress months of racing history into a glanceable format, but they're only the starting point.
Beneath the raw results sit speed figures — Timeform ratings, Racing Post Ratings (RPR), and increasingly, sectional timing data that breaks each race into segments. Speed figures standardise performances across different courses and conditions, though they're most reliable when comparing performances on similar ground and at similar distances.
Going conditions — the state of the ground, from Firm through Good to Soft and Heavy — affect every horse differently. The race card shows each horse's record on different going, and ignoring it is one of the costliest beginner mistakes.
The number of horses in training dropped to 21,728 in 2025, and average Flat field sizes shrank to 8.90 runners. Jumps meetings averaged just 7.84. Smaller fields mean fewer value opportunities — with only six or seven runners, the market tends to be priced more efficiently. Larger fields, particularly at Premier meetings where Flat fields averaged 11.02, offer more room for the bookmaker to misprice a runner.
Do
- Cross-reference at least three data points — form figures, speed ratings, and going record — before forming a view on any horse
- Focus on the most recent two or three runs, weighting them more heavily than older form
- Check the trainer's current strike rate over the past 14 days — hot stables tend to stay hot in clusters
- Note class changes: a horse dropping in class often outperforms expectations
Don't
- Rely on a single speed figure — one fast time on a downhill track with a strong tailwind is not a pattern
- Ignore the draw in flat races, particularly at courses like Chester and Beverley where stall position can determine the result
- Assume last season's form carries over without adjustment — horses change between campaigns
- Confuse consistency with quality: a horse that finishes 3rd, 3rd, 3rd might just be a 3rd-place horse
For a full breakdown of race card symbols, speed figure systems, and a step-by-step form analysis workflow, head to the dedicated horse racing form analysis guide.
Form analysis tells you which horses deserve a closer look. But even the sharpest selection process falls apart without a plan for how much to stake — and when to walk away. That's where bankroll management comes in.
Bankroll Management: Protecting Your Betting Capital
In 2019, I had a 14-bet losing streak. Every selection was justified, every price represented value, and every single one lost. My bankroll dropped 28%. I didn't panic, didn't chase, didn't increase my stakes — and by the end of that month, the next 20 bets brought me back to profit. That experience taught me more about betting than any winner ever has: the strategy that keeps you in the game during the bad runs is the one that lets you be there for the good ones.
"Profitable betting is a marathon, not a sprint — it requires discipline, patience, and proper bankroll management." That line from one of the sharper analytical sites in the space is the truest sentence anyone has written about this subject. Yet bankroll management is the section most punters skip, because it's boring. Boring keeps you solvent.
The unit system: setting your base stake
Start with a dedicated betting bank — money that's entirely separate from your living expenses. Divide that bank into units. A common approach is 100 units: if your bank is £1,000, one unit is £10.
Standard bets: 1 unit. Strong conviction bets: 2 units, maximum. Never more than 2 units on a single race. If your bank drops to £800, your unit drops to £8. If it grows to £1,200, your unit rises to £12. The bank dictates the stake, never the other way round.
At 1-unit stakes across a 100-unit bank, you can withstand a 20-bet losing streak and still have 80% of your capital. At 5-unit stakes, that same streak wipes out your entire bank.
The more sophisticated approach is the Kelly Criterion — a formula that sizes your bet based on the perceived edge and the odds on offer. Full Kelly is mathematically optimal for growth but volatile, so most serious punters use fractional Kelly (quarter or half) to smooth the swings. The maths and practical application are covered in my horse racing bankroll management guide.
Variance is not a sign that your strategy is broken. In a game where the best professionals hit 52-55% of their bets, losing runs of 10, 15, even 20 bets are not unlikely — they're inevitable. The only question is whether your staking plan can survive them.
Record everything. Date, race, selection, odds taken, stake, result, running profit/loss. I use a simple spreadsheet, updated after every bet. Without records, you can't calculate your ROI, identify which race types are most profitable for you, or spot when a strategy has genuinely stopped working versus when you're just in a natural variance dip. The discipline of recording forces you to treat betting as a process rather than a series of isolated punts.
Bankroll management determines how long you stay in the game. Now let's look at the specific strategies you'll deploy with that protected capital — starting with dutching, the method that lets you back more than one horse without doubling your risk.
Dutching: Spreading Risk Across Multiple Selections
Picture this: you've analysed a 12-runner handicap and narrowed the field to three genuine contenders. You're confident the winner comes from that trio, but you can't separate them. Most punters pick one and hope. Dutching lets you back all three, adjusting your stakes so you make the same profit regardless of which one wins. It's one of the oldest techniques in racing — named, allegedly, after the Dutch bookmakers who popularised it — and it's one of the most underused.
The principle is straightforward. Instead of placing equal stakes on each selection, you weight your stakes inversely to the odds. The horse at shorter odds gets a larger share of your total outlay; the longer-priced horse gets less. The result is a level return across all selections.
Dutching three horses in a handicap (illustrative example)
Your total budget for this race: £30. The three selections are priced at 3/1 (decimal 4.00), 5/1 (decimal 6.00), and 8/1 (decimal 9.00). These are hypothetical prices to show the method — apply the same steps to any real race.
Step 1: Convert to implied probabilities. 1/4.00 = 0.250. 1/6.00 = 0.167. 1/9.00 = 0.111. Sum = 0.528.
Step 2: Calculate each stake. Stake = (individual implied probability / sum of implied probabilities) x total budget.
Horse A (3/1): (0.250 / 0.528) x £30 = £14.20
Horse B (5/1): (0.167 / 0.528) x £30 = £9.49
Horse C (8/1): (0.111 / 0.528) x £30 = £6.31
Step 3: Check the return. If Horse A wins: £14.20 x 4.00 = £56.80. If Horse B wins: £9.49 x 6.00 = £56.94. If Horse C wins: £6.31 x 9.00 = £56.79. Each outcome returns approximately £56.80 on a £30 outlay — a profit of roughly £26.80 regardless of which horse wins.
| Selection | Odds (decimal) | Stake | Return if wins | Profit if wins |
|---|---|---|---|---|
| Horse A | 4.00 | £14.20 | £56.80 | £26.80 |
| Horse B | 6.00 | £9.49 | £56.94 | £26.94 |
| Horse C | 9.00 | £6.31 | £56.79 | £26.79 |
Dutching works best when you genuinely believe multiple horses have a realistic chance and the combined implied probability of your selections is well below 100%. If it's above 100%, you're guaranteed a loss — you're essentially recreating the bookmaker's overround against yourself. It also works best in larger fields with open handicaps, where the market is less likely to have the correct horse nailed as a short-priced favourite.
Where dutching struggles is in small fields with a dominant favourite. If one horse is 1/2 and the rest are 8/1 or longer, the favourite's price absorbs too much of your budget. I dutch when my shortlist contains two or three horses priced between 3/1 and 10/1, and skip it when the market is dominated by a sub-evens favourite.
Each-Way Betting: When It Pays and When It Doesn't
Each-way is probably the most popular bet type among UK racing punters — and probably the most misunderstood. I spent years treating it as a safety net: "even if it doesn't win, I'll get something back." That reasoning cost me money, because each-way isn't a safety net. It's two separate bets, and unless the maths favours both parts, you're paying for insurance you don't need.
When you place a £10 each-way bet, you're making two £10 bets — £20 total. The first is a win bet at the full odds. The second is a place bet at a fraction of the odds, typically 1/4 or 1/5 depending on runners and race type. Standard terms pay for the first two in five-to-seven-runner fields (at 1/4 odds), the first three in fields of eight or more (at 1/5 odds), and the first four in handicaps of 16+ runners (at 1/4 odds).
| Scenario | Win bet (£10 at 10/1) | Each-way (£10 EW at 10/1, 1/4 odds) | Place-only (£20 at 5/2) |
|---|---|---|---|
| Horse wins | +£100 | +£100 (win) + £25 (place) = +£105 on £20 stake | +£50 |
| Horse places (not wins) | -£10 | -£10 (win part) + £25 (place) = +£5 on £20 stake | +£50 |
| Horse unplaced | -£10 | -£20 | -£20 |
The key insight is that the each-way bet is only good value when the place part carries positive expected value on its own — when the horse's realistic chance of placing justifies the fractional odds. A horse at 10/1 with a 1/4 place fraction gives you effective place odds of 5/2. If you think that horse has better than a 28.6% chance of finishing in the places, the place part alone is a value bet. If you think it's closer to 20%, you're overpaying.
Andrew Black, the founder of Betfair, has called each-way betting "a dinosaur fit for extinction" and argued for replacing it with a performance-based system. It's a provocative position, but the underlying maths supports his scepticism: the place fraction is set by convention, not by analysis, and frequently fails to reflect the actual probability of placings in a given race.
Each-way betting isn't inherently bad — it's situationally bad. In large-field handicaps with 16+ runners, where four places are paid and the favourite is 5/1 or longer, the place market tends to offer genuine value. In small fields of six or seven with a dominant favourite, the each-way bet almost always favours the bookmaker.
I use each-way selectively: big-field handicaps at major meetings, where the place terms are generous and the market is wide open. For everything else, I prefer a straight win bet at better odds or, if I genuinely think a horse will place but not win, a place-only bet on an exchange. The full mathematical framework for deciding when each-way offers genuine edge is in my each-way betting strategy guide.
Exchange Betting: Why Betfair Changed UK Horse Racing
When betting exchanges launched in the early 2000s, the traditional bookmaking industry reacted as though someone had set fire to the rulebook. For the first time, punters could bet against each other rather than against a bookmaker — and the structural advantage that bookmakers had enjoyed for centuries shrank overnight. Twenty years on, exchanges remain the single most important innovation in UK racing betting.
The typical overround on the back side of an exchange market sits between 101% and 105% — compared to 115-125% at a traditional bookmaker. That difference in margin is, over thousands of bets, the difference between turning a profit and slowly bleeding money.
The exchange model is peer-to-peer. When you "back" a horse, another user is "laying" it — betting that it won't win. The exchange takes a commission on winning bets (typically 2-5% depending on your activity level) rather than building a margin into the odds. The result is consistently better prices for backers and, for the first time, the ability to bet that a horse will lose — a tool that opens up an entirely different strategic dimension.
Back — betting that an outcome will happen, just like a traditional bet. On an exchange, someone else is taking the other side of your bet.
Lay — betting that an outcome will not happen. If you lay a horse at 4.00 for £10, you're accepting £10 from a backer and paying out £30 (their £10 stake x 3 profit) if the horse wins. Your liability is £30, but you keep the £10 stake if the horse loses.
Commission — the percentage the exchange deducts from your net winnings on a market. This replaces the bookmaker's overround as the exchange's revenue model.

The strategic applications go beyond better odds. Back-to-lay trading lets you back a horse at a higher price and lay it at a lower price as the market moves, locking in profit regardless of the result. In-play trading adds another layer: if your backed horse breaks well, its exchange price drops, letting you lay at shorter odds and guarantee a return.
| Feature | Traditional bookmaker | Betting exchange |
|---|---|---|
| Typical overround | 115-125% | 101-105% |
| Lay betting available | No | Yes |
| In-play trading | Limited (cash-out only) | Full market, real-time |
| Revenue model | Margin built into odds | Commission on winnings |
| Best Odds Guaranteed | Yes (most major operators) | No |
| Account restrictions | Common for winning punters | Rare |
One practical advantage that doesn't get enough attention: exchanges rarely restrict profitable bettors. Traditional bookmakers will limit your stakes or shut you down entirely once you start winning consistently. On an exchange, you're welcome as long as you generate commission. For anyone with a long-term strategy, this difference alone makes exchange accounts essential.
I use both. Bookmakers for Best Odds Guaranteed markets and early prices. Exchanges for everything else — better odds, lay options, and freedom to trade in-play. The full mechanics are in my horse racing betting exchanges guide.
Exotic Bets: Exacta, Trifecta, and Multi-Race Wagers
Nobody forgets their first big exotic payout. Mine was a trifecta at Newmarket — £340 from a £6 stake. The less romantic truth: I'd placed roughly 50 losing trifectas before that one, spending over £200 in the process. The net gain was real but smaller than it felt, and that's the fundamental tension with exotic bets. The payouts are spectacular, the hit rate is brutal.
Trifecta box cost by number of selections
A trifecta box covers every possible first-second-third combination of your chosen horses. The formula is: number of selections x (n-1) x (n-2) x unit stake.
3 horses boxed: 3 x 2 x 1 = 6 combinations = £6 at £1 per combo
4 horses boxed: 4 x 3 x 2 = 24 combinations = £24
5 horses boxed: 5 x 4 x 3 = 60 combinations = £60
6 horses boxed: 6 x 5 x 4 = 120 combinations = £120
Costs escalate fast. Boxing five horses at £1 costs more than many punters' entire race-day budget.
Exactas — picking the first and second in correct order — are cheaper and more manageable. A reverse exacta (covering both possible orders of your two selections) costs just two units. A part-wheel, where you fix one horse in first and use several others for second, gives you flexibility without the cost explosion of a full box. I use exactas far more often than trifectas, because the cost-to-payout ratio is more sustainable over a season.
Exotics work best in larger fields where the market is wide open and short-priced favourites are absent. My personal rule: I only consider a trifecta in races with 12 or more runners where the favourite is 3/1 or longer. Below that threshold, the favourite's involvement compresses the payout, and the permutation cost rarely justifies the expected return.
Multi-race wagers — Pick 3, Pick 4, and their variants — reward good handicapping across consecutive events and can offer value when pools carry over from previous meetings. The key discipline is ticket cost management: structure your selections with one or two "singles" (races where you use a single horse) and "spreads" rather than using four horses in every leg.
Exotics aren't core to my strategy — they account for perhaps 10-15% of my total wagers. But when the conditions are right, they add a layer of upside that straight win and each-way bets can't match.
The UK Regulatory Landscape: What Bettors Need to Know
In the summer of 2024, a punter I know — consistent winner, meticulous records, five-figure annual turnover — received an affordability check mid-Cheltenham. His account was frozen for 48 hours while he submitted proof of income. By the time the freeze lifted, the ante-post prices he'd been tracking had shortened by three or four points. He wasn't gambling recklessly. He was profitable and compliant. But the rules had changed.
Affordability checks are part of the Gambling Commission's enhanced player protection framework, introduced as part of the Gambling Act Review. Licensed operators are required to assess whether customers can afford their level of gambling, triggering checks based on spending thresholds. The checks can involve requests for payslips, bank statements, or other proof of income.
The broader regulatory picture is reshaping how and where UK punters bet on racing. Total online betting turnover on horse racing has declined by £1.6 billion over two years — closer to £3 billion in real terms after adjusting for inflation. Part of that decline reflects shifting recreational behaviour, but part is being pushed somewhere the regulators didn't intend.
Traffic to 22 unlicensed offshore betting sites that accept wagers on British racing surged by 522% in unique visitors between August 2021 and September 2024, according to the International Federation of Horseracing Authorities. Total traffic grew 131%, dwarfing the 49% growth in unique visitors to the top 10 licensed operators. The Betting and Gaming Council estimates that 1.5 million Britons now spend up to £4.3 billion annually on the unregulated market.
Brant Dunshea, the BHA's Acting Chief Executive, has warned repeatedly that well-meaning regulatory reforms risk inadvertently growing the illegal market — a concern he says this data now validates. He's also stressed that every punter who moves to the unregulated market does so without consumer protections and makes no financial contribution to British racing or the Exchequer.
The black market is not a neutral alternative. Unlicensed operators offer no dispute resolution, no self-exclusion tools, no responsible gambling protections, and no contribution to the prize money and breeding industries that sustain British racing. If something goes wrong — and it will, eventually — there's no regulator to turn to.
For legitimate punters, the practical impact is threefold. First, expect affordability checks if your turnover exceeds certain thresholds — keep clean financial records to clear them quickly. Second, diversify across multiple licensed operators so a frozen account doesn't strand you at a critical moment. Third, prioritise exchange accounts: they face the same regulatory framework but rarely restrict winning punters.
The Horserace Betting Levy Board collected a record £108.9 million in 2024/25 — the highest since the levy reforms of 2017. But average turnover per race has fallen 19% over three years. The levy's health depends on betting volume, and volume is under pressure from both regulatory friction and black market growth.
Your Pre-Bet Checklist: Seven Steps Before Every Wager
Every professional I've spoken to has some version of a pre-bet routine — a mental or physical checklist they run through before money leaves their account. I developed mine after a particularly expensive Saturday at Ascot where I backed four horses on gut feeling and lost the lot. The checklist doesn't guarantee winners. It guarantees that every bet I place has been through a consistent process, and that I never lose money on something I didn't actually think through.
Run these seven checks before placing any bet
- Form check: Have I reviewed the last three runs for every horse I'm considering? Do I understand why each horse finished where it did — not just the position, but the circumstances?
- Going check: Do I know the current ground conditions, and have I checked each horse's record on that going? Has the going changed since declarations?
- Value check: Have I estimated the horse's true winning probability, and do the available odds exceed my estimate? If not, this isn't a bet — it's a preference.
- Price comparison: Have I checked at least three bookmakers and the exchange price? Am I getting the best available odds, or am I leaving money on the table?
- Stake check: Is my stake within my unit system? Am I tempted to go above 2 units? If yes, why — conviction or desperation?
- Market context: Is the horse shortening or drifting? If it's drifting hard, do I know why — and does that information change my assessment?
- Emotional check: Am I betting this race because I've done the analysis, or because I'm bored, chasing a loss, or just want the buzz of having something on? If the answer is anything other than analysis, I close the app.
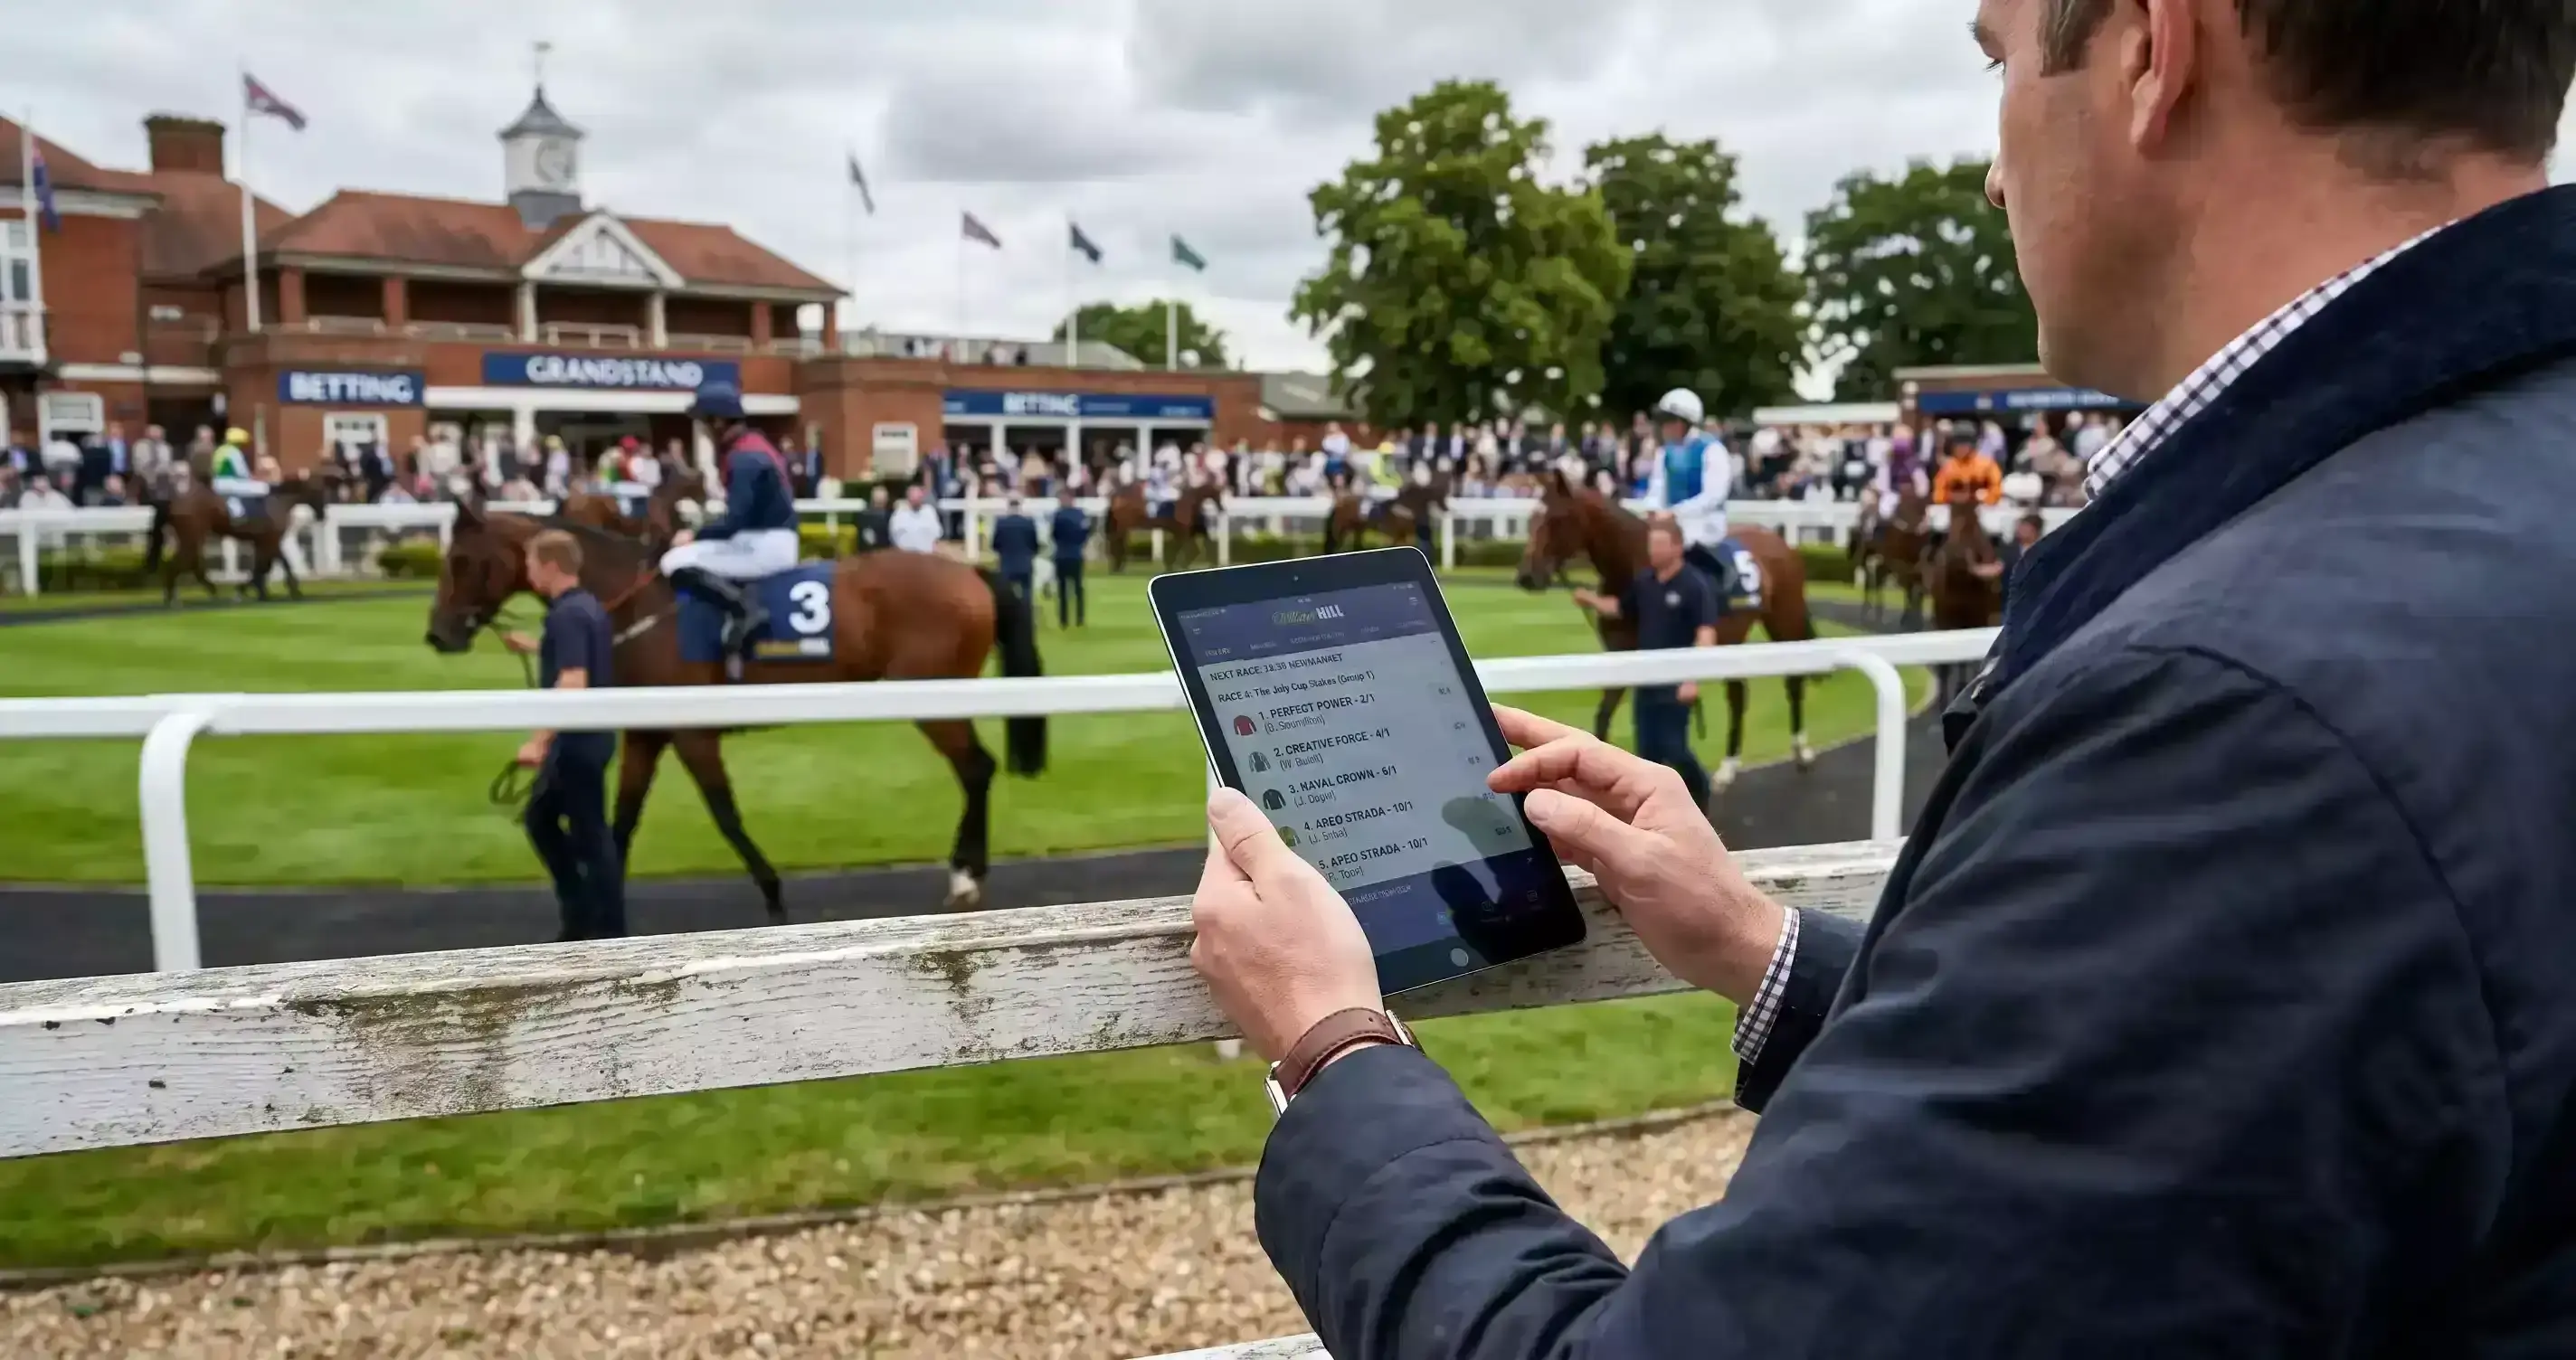
This takes me about three minutes per race. It sounds mechanical, and it is. That's the point. The bets that hurt worst in my career weren't the unlucky losers — they were the lazy bets, the ones I placed without doing the work. A checklist eliminates lazy bets. Over a 500-bet season, eliminating even 30 lazy bets at an average loss of one unit each saves you 30 units.
Frequently Asked Questions
How often do favourites win horse races in the UK?
Across all UK races, favourites win approximately 34.4% of the time. In non-handicaps, that figure climbs to about 39%. In handicaps, it drops to roughly 25.7%. Odds-on favourites on flat turf convert at about 59%. The key takeaway: favourites lose the majority of races in every category, which is why strategies like dutching and laying exist.
What is the best staking plan for horse racing?
No single plan suits everyone. Flat staking (1 unit per bet) is simplest and most forgiving. The Kelly Criterion optimises bankroll growth but is volatile — most serious bettors use quarter or half Kelly. My recommendation for beginners: flat staking at 1 unit with a 100-unit bank. Graduate to fractional Kelly once you have 500+ bets of track record and a positive ROI.
Is dutching a profitable long-term strategy?
Dutching is a staking method, not an edge in itself. It's profitable if your selections collectively offer value — their combined true probability exceeds the combined implied probability of their prices. Dutching amplifies good analysis by covering multiple contenders efficiently, but the underlying selection work still needs to be right.
How do you calculate value in horse racing odds?
Value exists when the available odds exceed your estimate of the horse's true chance. Convert odds to implied probability (for fractional odds a/b: b divided by a+b). Compare that to your own assessment. The formal measure is Expected Value: EV = (your probability x net profit) minus (probability of losing x stake). Positive EV means the bet has value over time.
What is the bookmaker's overround and how does it affect my bets?
The overround is the total of all implied probabilities in a race minus 100%. At most UK bookmakers it sits between 115% and 125%, meaning a 15-25% built-in margin. On exchanges, the back-side overround is typically 101-105%. The lower the overround, the better your starting position — which is why exchange prices are structurally superior for long-term profitability.
Is it better to bet with a bookmaker or on a betting exchange?
Both have advantages. Exchanges offer better odds, lay betting, and rarely restrict winning accounts. Bookmakers offer Best Odds Guaranteed and each-way terms. Most serious punters use both: bookmakers for BOG markets and early prices, exchanges for everything else. If forced to choose one, I'd pick an exchange — the structural price advantage compounds over hundreds of bets.
How important is bankroll management in horse racing betting?
It's the foundation every other strategy depends on. Without it, a losing run wipes you out before your edge materialises. With it, you survive variance, stay in the game for your positive EV bets to compound, and avoid chasing losses with oversized stakes. I've never met a profitable long-term bettor without a disciplined staking plan.