At Some UK Courses the Draw Decides the Race Before It Starts
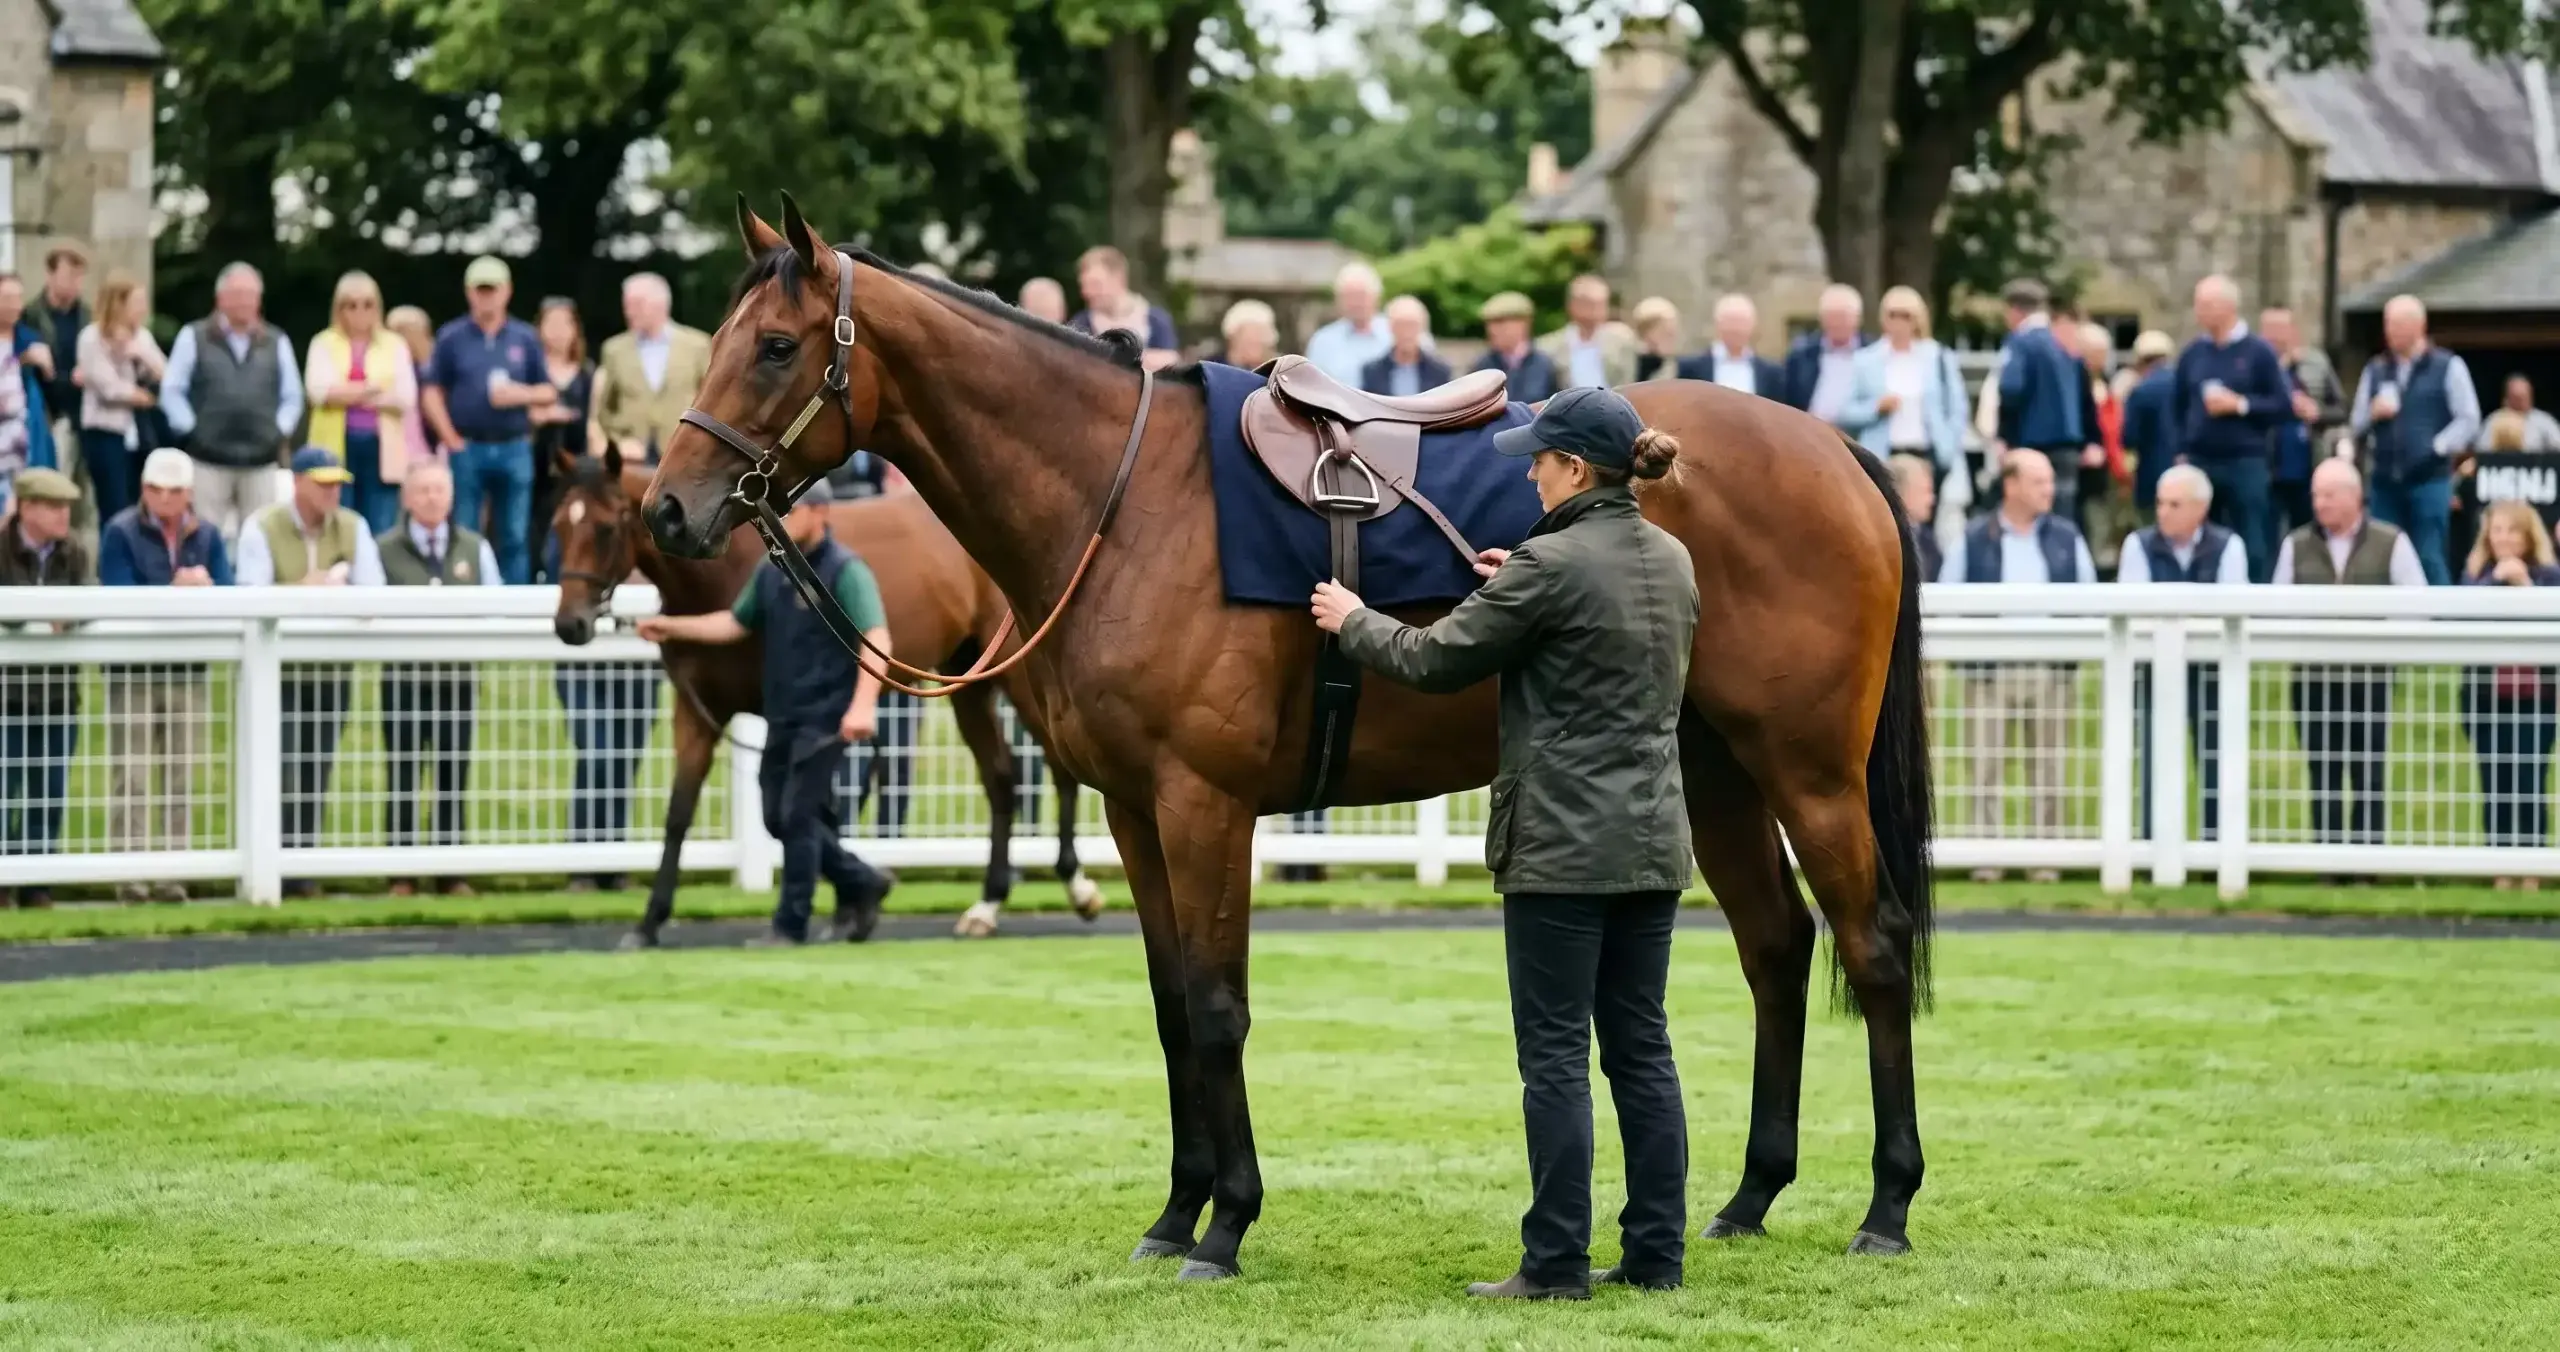
I spent a full season tracking my flat racing bets before I noticed an uncomfortable pattern. At certain courses, horses drawn low won far more often than the market suggested they should. At others, the high numbers dominated. My form analysis was solid, my value assessments reasonable — but I was ignoring a variable that, at specific tracks, overrides almost everything else on the race card.
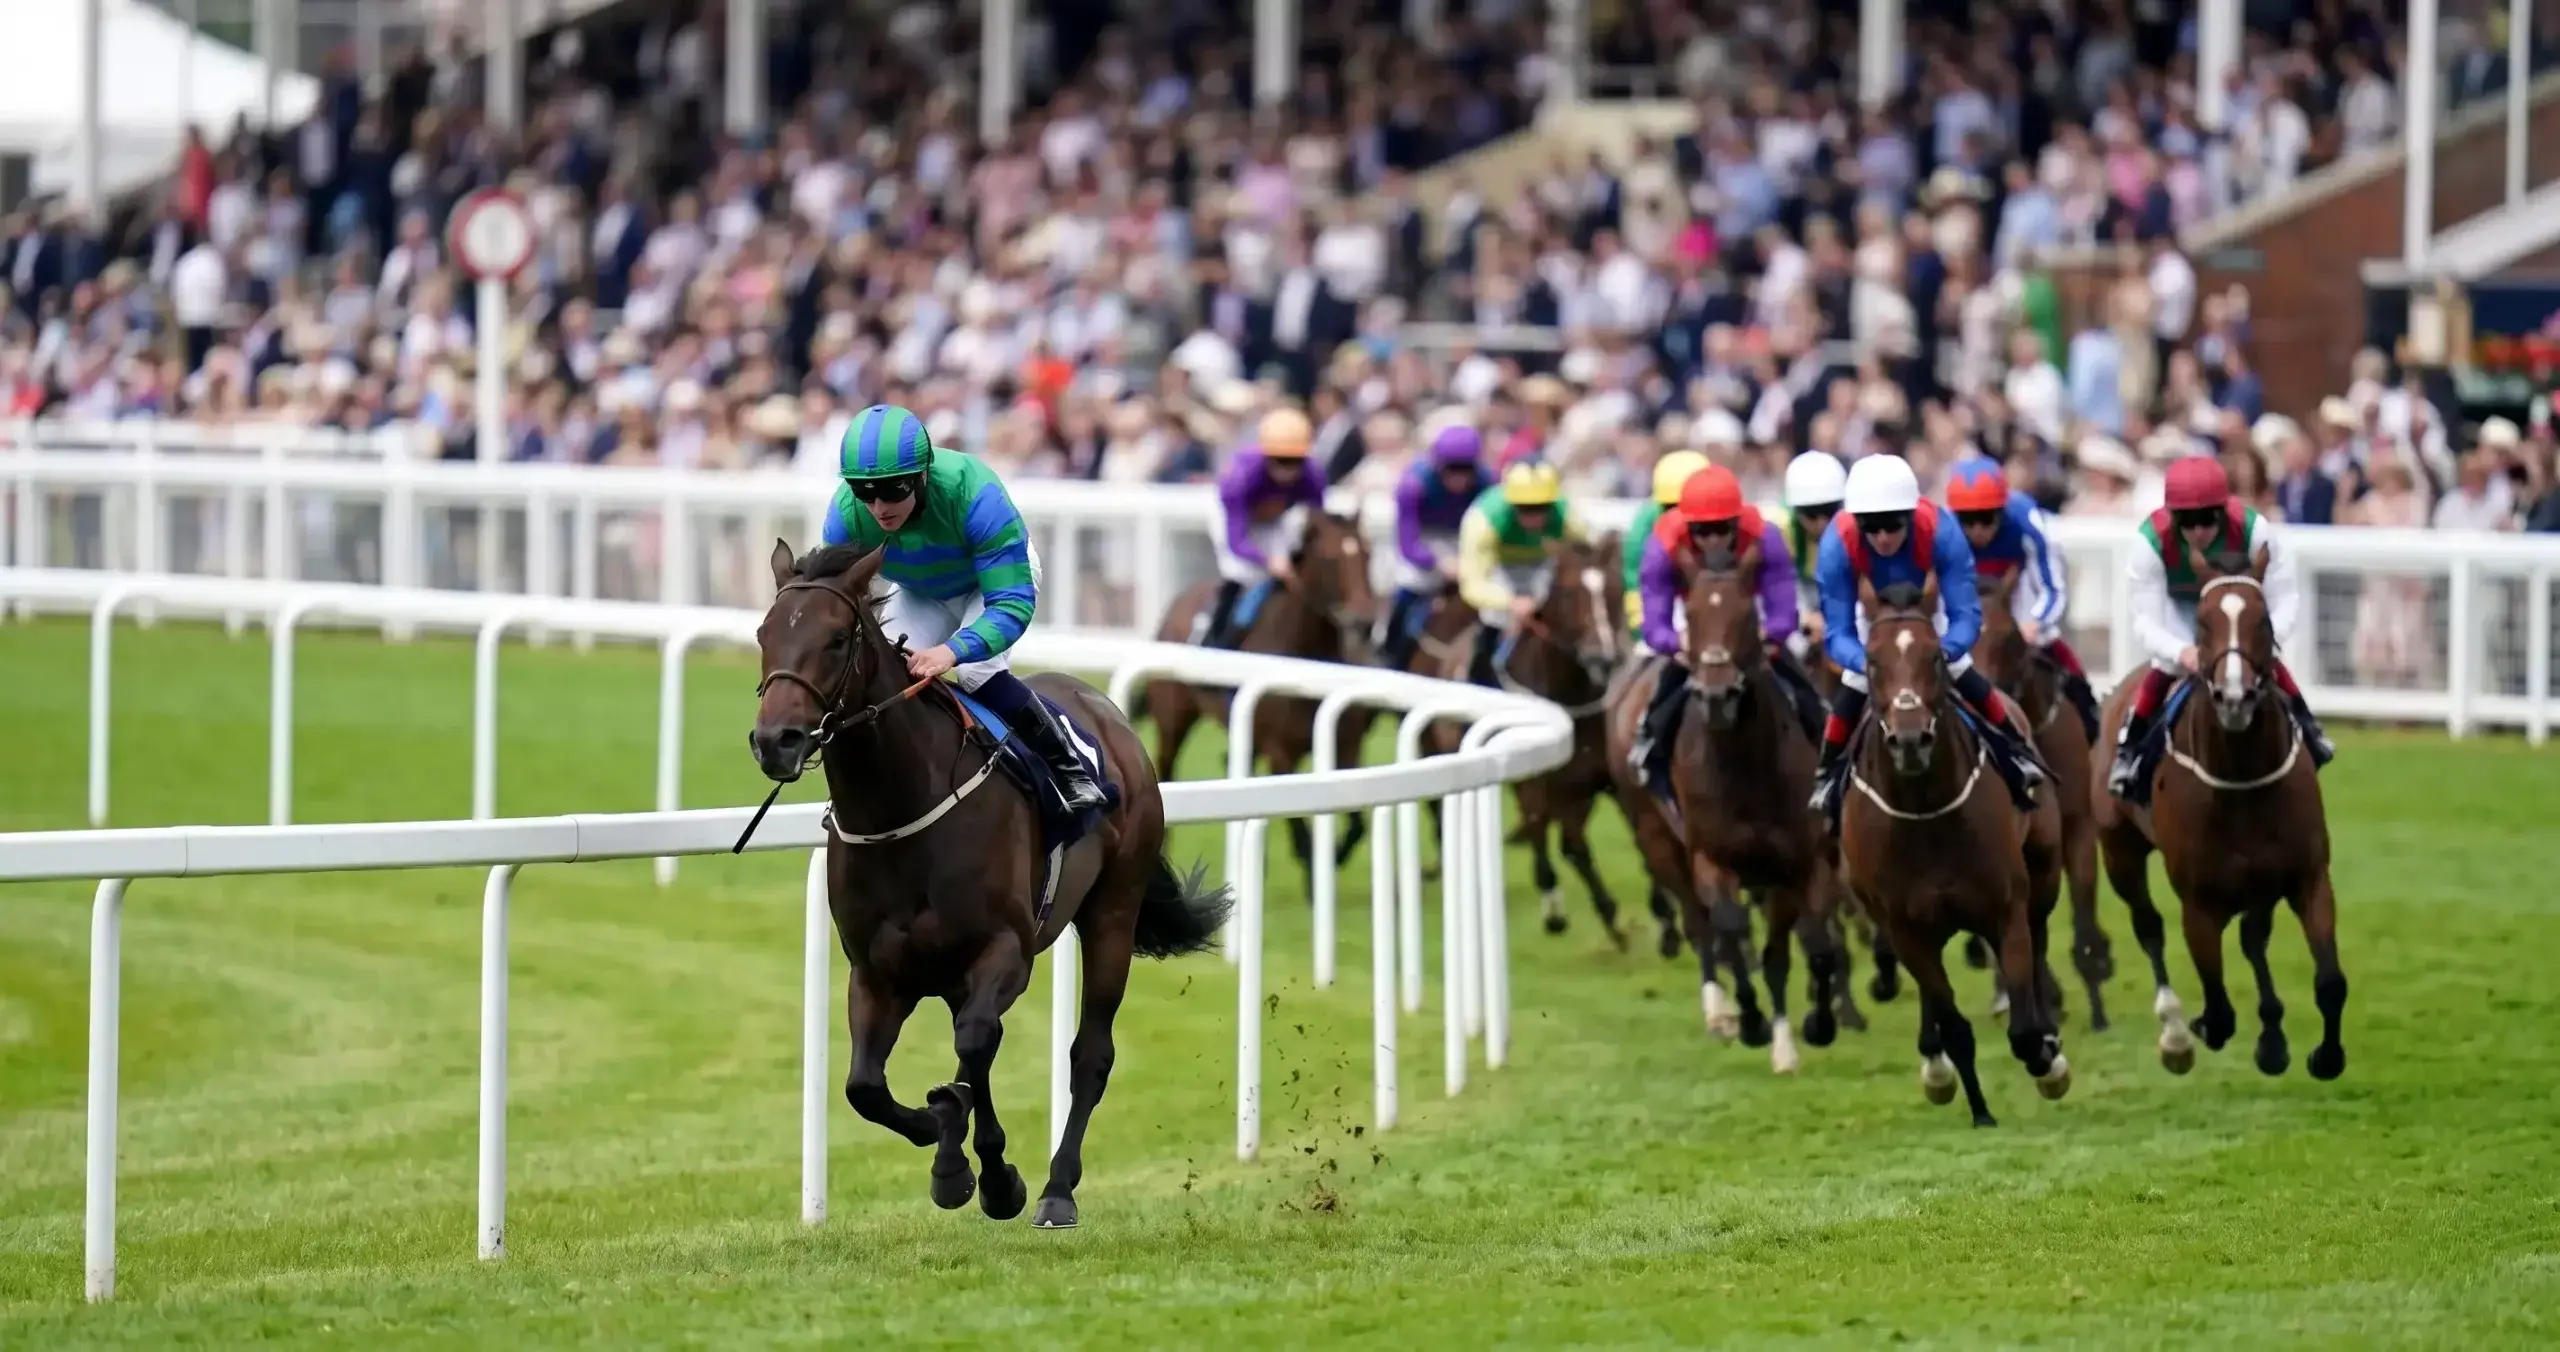
Draw bias is the statistical tendency for certain stall positions to produce more winners than others at a given course and distance. It exists because racecourses are not symmetrical playing fields. A left-handed track with camber throws the rail position into an advantage. A straight course where the ground dries faster on one side gives runners on that flank better footing. Average field sizes on UK flat racing have fallen to 8.90 runners, which means in smaller fields the draw effect is diluted — but in bigger fields at biased tracks, it can be decisive.
Understanding draw bias is a core part of thorough form analysis, and ignoring it at the wrong course is one of the most expensive mistakes a flat racing bettor can make. The data is freely available, the patterns are well documented, and the market still underweights the draw in many situations — particularly at meetings where casual punters dominate the betting pools.
What Causes Draw Bias: Camber, Width, and Going
Three physical characteristics of a racecourse determine whether a draw bias exists and how severe it is.
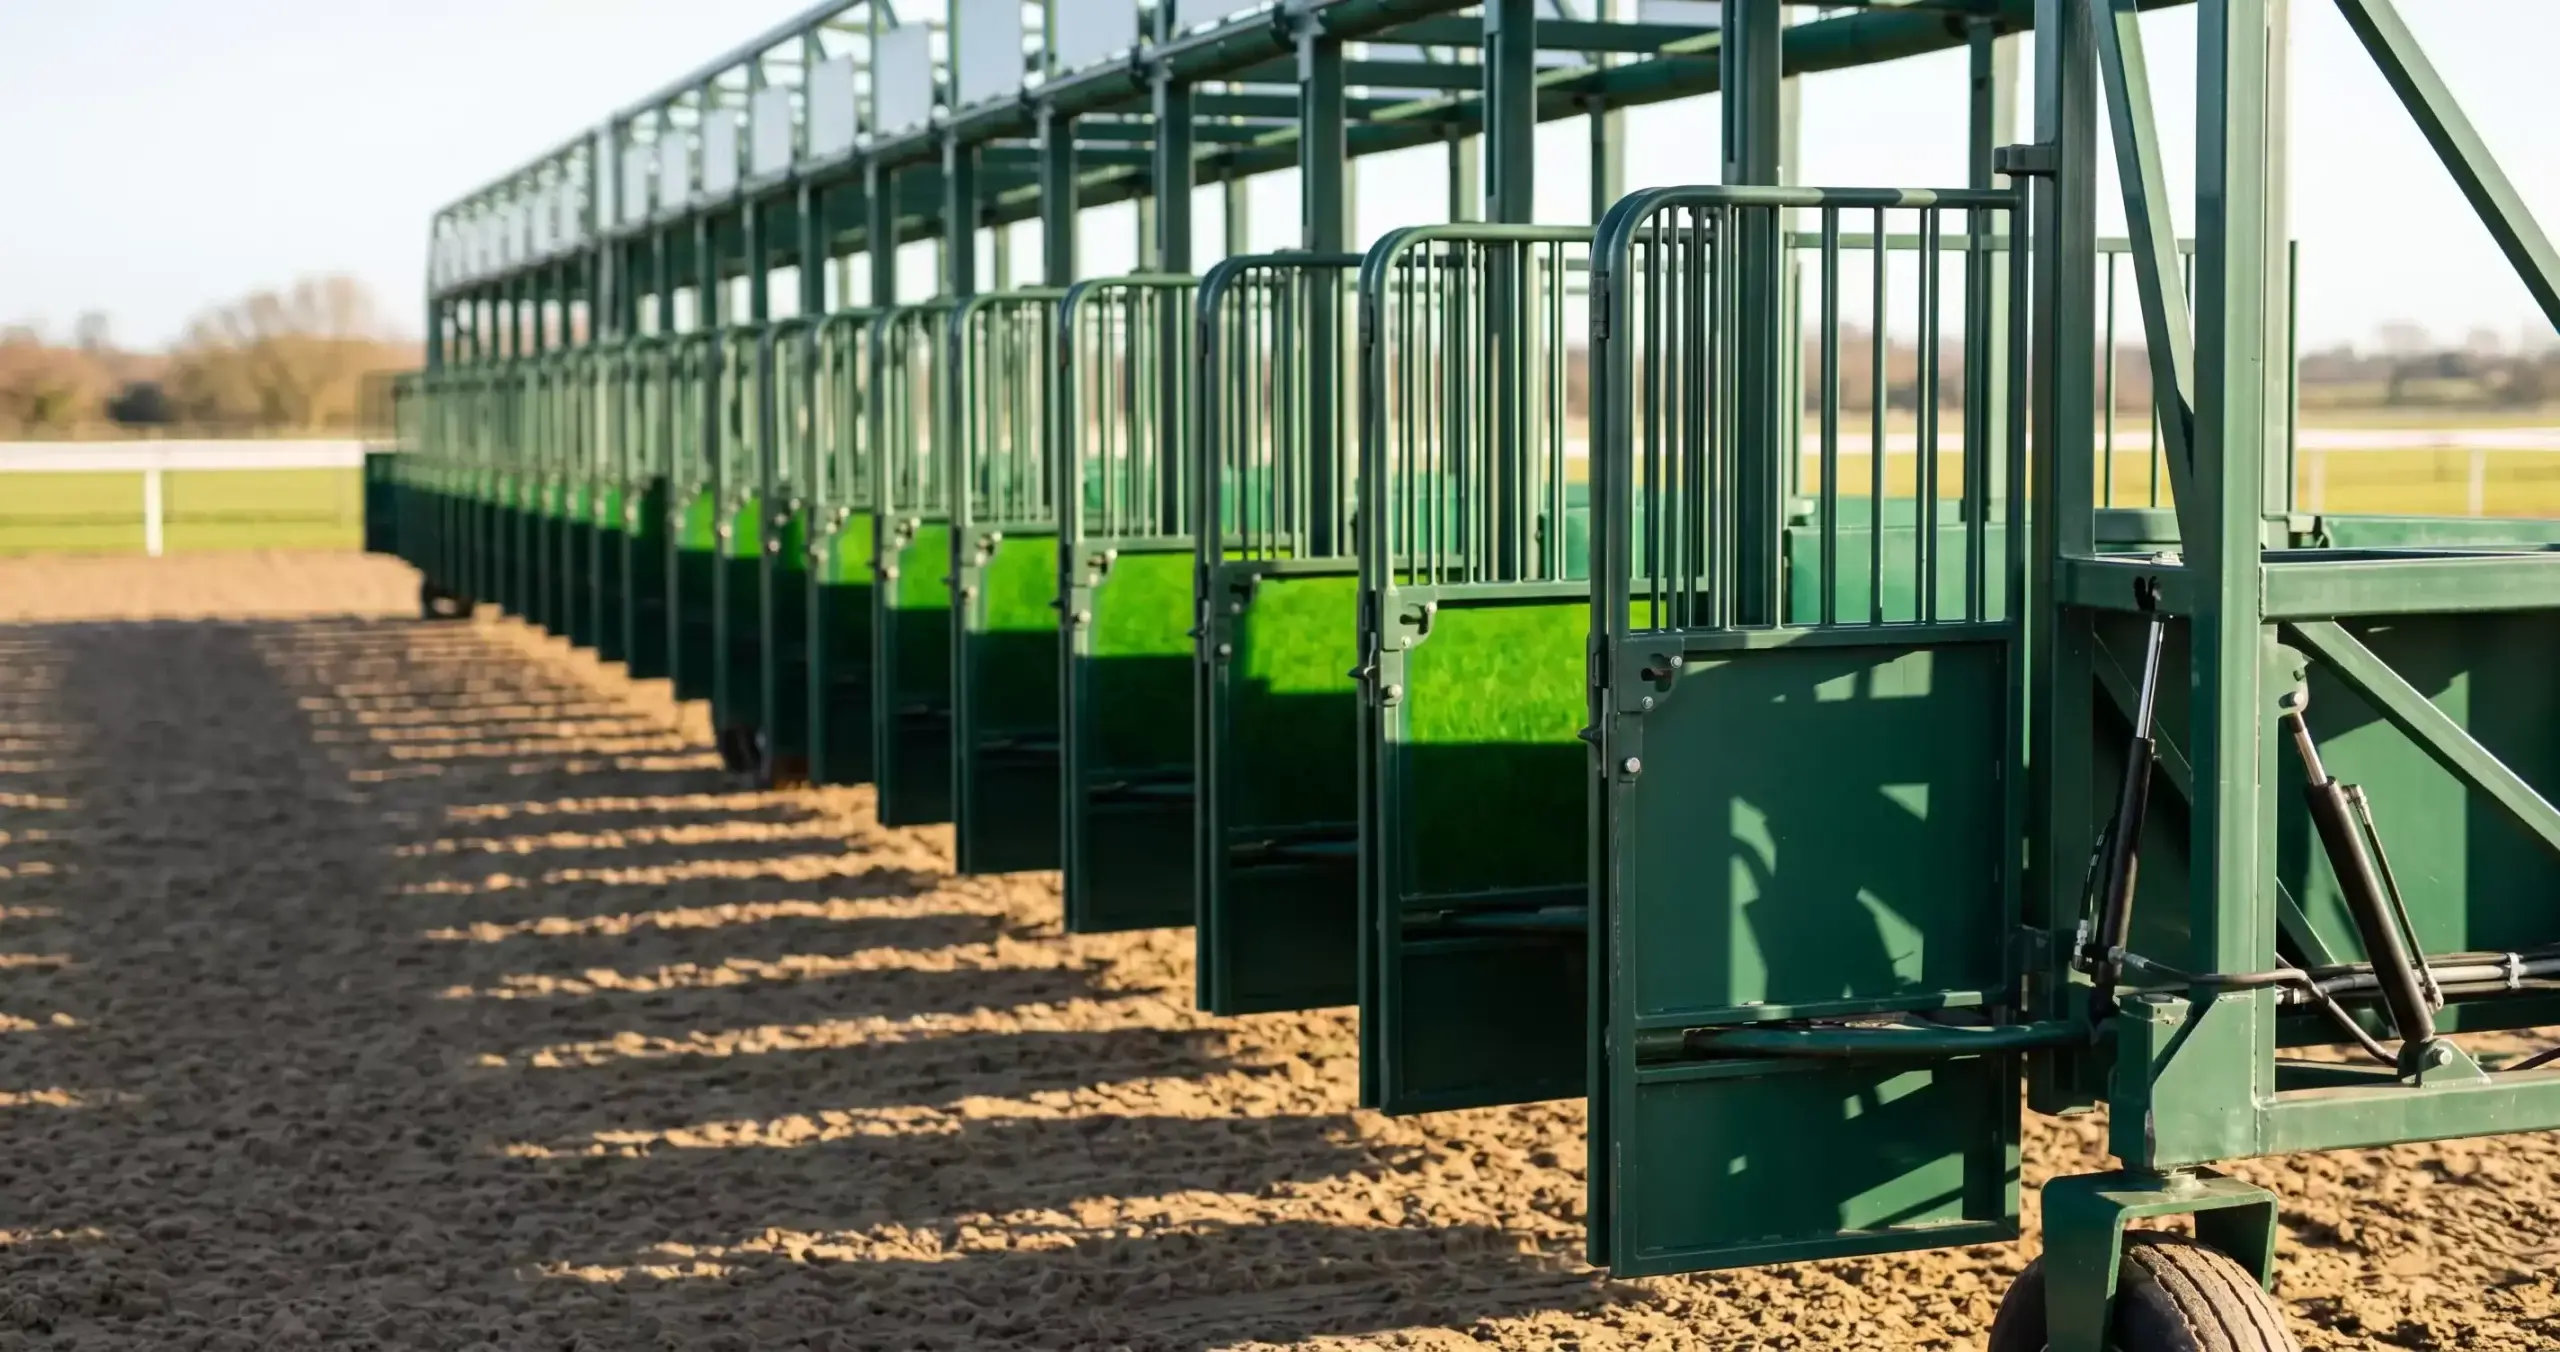
The first is camber. Most UK tracks are not flat — they’re banked slightly to help drainage. On a left-handed course with inward camber, horses drawn low (nearest the inside rail) travel a shorter distance around the bends and benefit from the natural slope pulling them towards the rail. The advantage compounds over longer distances with more turns. Chester, the tightest flat course in Britain, is the extreme example: the track is barely a mile round, turns constantly left, and the camber is aggressive. A horse drawn in stall one at Chester over five furlongs has a structural advantage that no amount of ability from a wide draw can easily overcome.
The second is track width. Narrow courses compress the field and amplify the rail advantage because there’s less room for wide-drawn horses to manoeuvre into a good position without losing ground. Wider courses — Newmarket’s Rowley Mile is the classic example — allow horses from any draw to find their preferred racing line without significant disadvantage.
The third, and most variable, is the going. After sustained rain, the ground near the inside rail often becomes the most churned-up strip of turf on the course, because that’s where the most traffic goes. When the rail is on the stands’ side and the ground is soft, runners drawn high and racing on the far side can find better footing. This effect reverses when conditions dry out. At courses like Beverley and Musselburgh, the going-related draw bias can flip within a single meeting if the weather changes between races.
Draw Bias by Course: Chester, Beverley, Musselburgh, and Windsor
The strength of draw bias varies enormously between courses. At some tracks it’s a permanent structural feature. At others it’s conditional, depending on distance, going, and field size. The key is knowing which courses demand attention to the draw and which are essentially neutral.
Chester is the most draw-biased flat course in Britain. Over five and six furlongs, low draws have a significant win-rate advantage that has persisted for decades. The tight, left-handed layout means wide-drawn horses must either use extra energy to cross over early or accept racing wide for the entire trip. Over longer distances the bias softens slightly because there’s more time to settle into position, but even over a mile and a half the inside draw retains an edge. If you’re betting at Chester and your selection is drawn in double figures in a full field, the data says you’re fighting the track as well as the opposition.
Beverley’s draw bias is distance-dependent. Over five furlongs on the straight course, a high draw (stands’ side) is advantageous, particularly on good-to-firm ground when the far rail offers the fastest strip. Over seven furlongs and beyond, where the course bends right-handed, low draws gain the advantage. The contrast between the two configurations is striking — backing high draws over five furlongs and low draws over seven furlongs at Beverley has been a profitable filter for years.
Musselburgh produces one of the most consistent high-draw biases in UK flat racing. The right-handed track favours stands’ side runners over the sprint distances, and the effect strengthens on faster ground. When the going is good or firmer and the field has 10 or more runners, horses drawn in the top third of the stall numbers produce a disproportionate share of winners. Average betting turnover per race at Premier fixtures rose 2.7% even as Core fixtures declined 8.6% — and Musselburgh’s Premier meetings are exactly the type where draw knowledge gives an edge over the casual weekend bettor.
Windsor, a figure-of-eight course that switched from evening-only to a mixed schedule, shows moderate low-draw bias over shorter distances. The sharp bends and relatively narrow track make inside berths valuable over five and six furlongs. Over a mile and beyond, the bias is negligible. Windsor’s bias is weaker than Chester’s or Musselburgh’s, but it’s consistent enough to be worth factoring into any selection process.
Courses with minimal or no draw bias include Newmarket (Rowley Mile and July Course), Goodwood (too complex and undulating for a consistent pattern), and Ascot (where field size and going create temporary biases that don’t persist across seasons).
Incorporating Draw Data Into Your Betting Selections
The practical question is when draw data should upgrade or downgrade a selection — and when it should be ignored entirely.
Draw bias matters most in large fields at biased courses over sprint distances. In a 16-runner handicap at Chester over five furlongs, the draw is arguably the single most important factor in the race. In a 6-runner conditions stakes at Newmarket over a mile and a half, the draw is close to irrelevant. The strength of the bias scales with field size because more runners means more congestion, and congestion amplifies the advantage of a good starting position.
I use draw data as a filter, not a primary selection tool. After identifying horses with the form, fitness, and going preference to be competitive, I check whether their draw supports or undermines their chance. A horse with strong claims but a poor draw at a biased course gets downgraded — not eliminated, but the stake goes down. A horse with solid but unspectacular form and a perfect draw at a heavily biased track gets upgraded, because the track geometry is doing work that the form figures don’t fully capture.
The most profitable application is identifying well-drawn horses that the market has priced based on form alone. If a 10/1 shot has a low draw at Chester in a 14-runner sprint and its recent form is reasonable, the market may be undervaluing the draw advantage. Conversely, a 2/1 favourite drawn widest of all in the same race faces a structural headwind that isn’t always reflected in its price. That asymmetry — where the draw adds information the market hasn’t fully processed — is where draw bias data generates real value.