

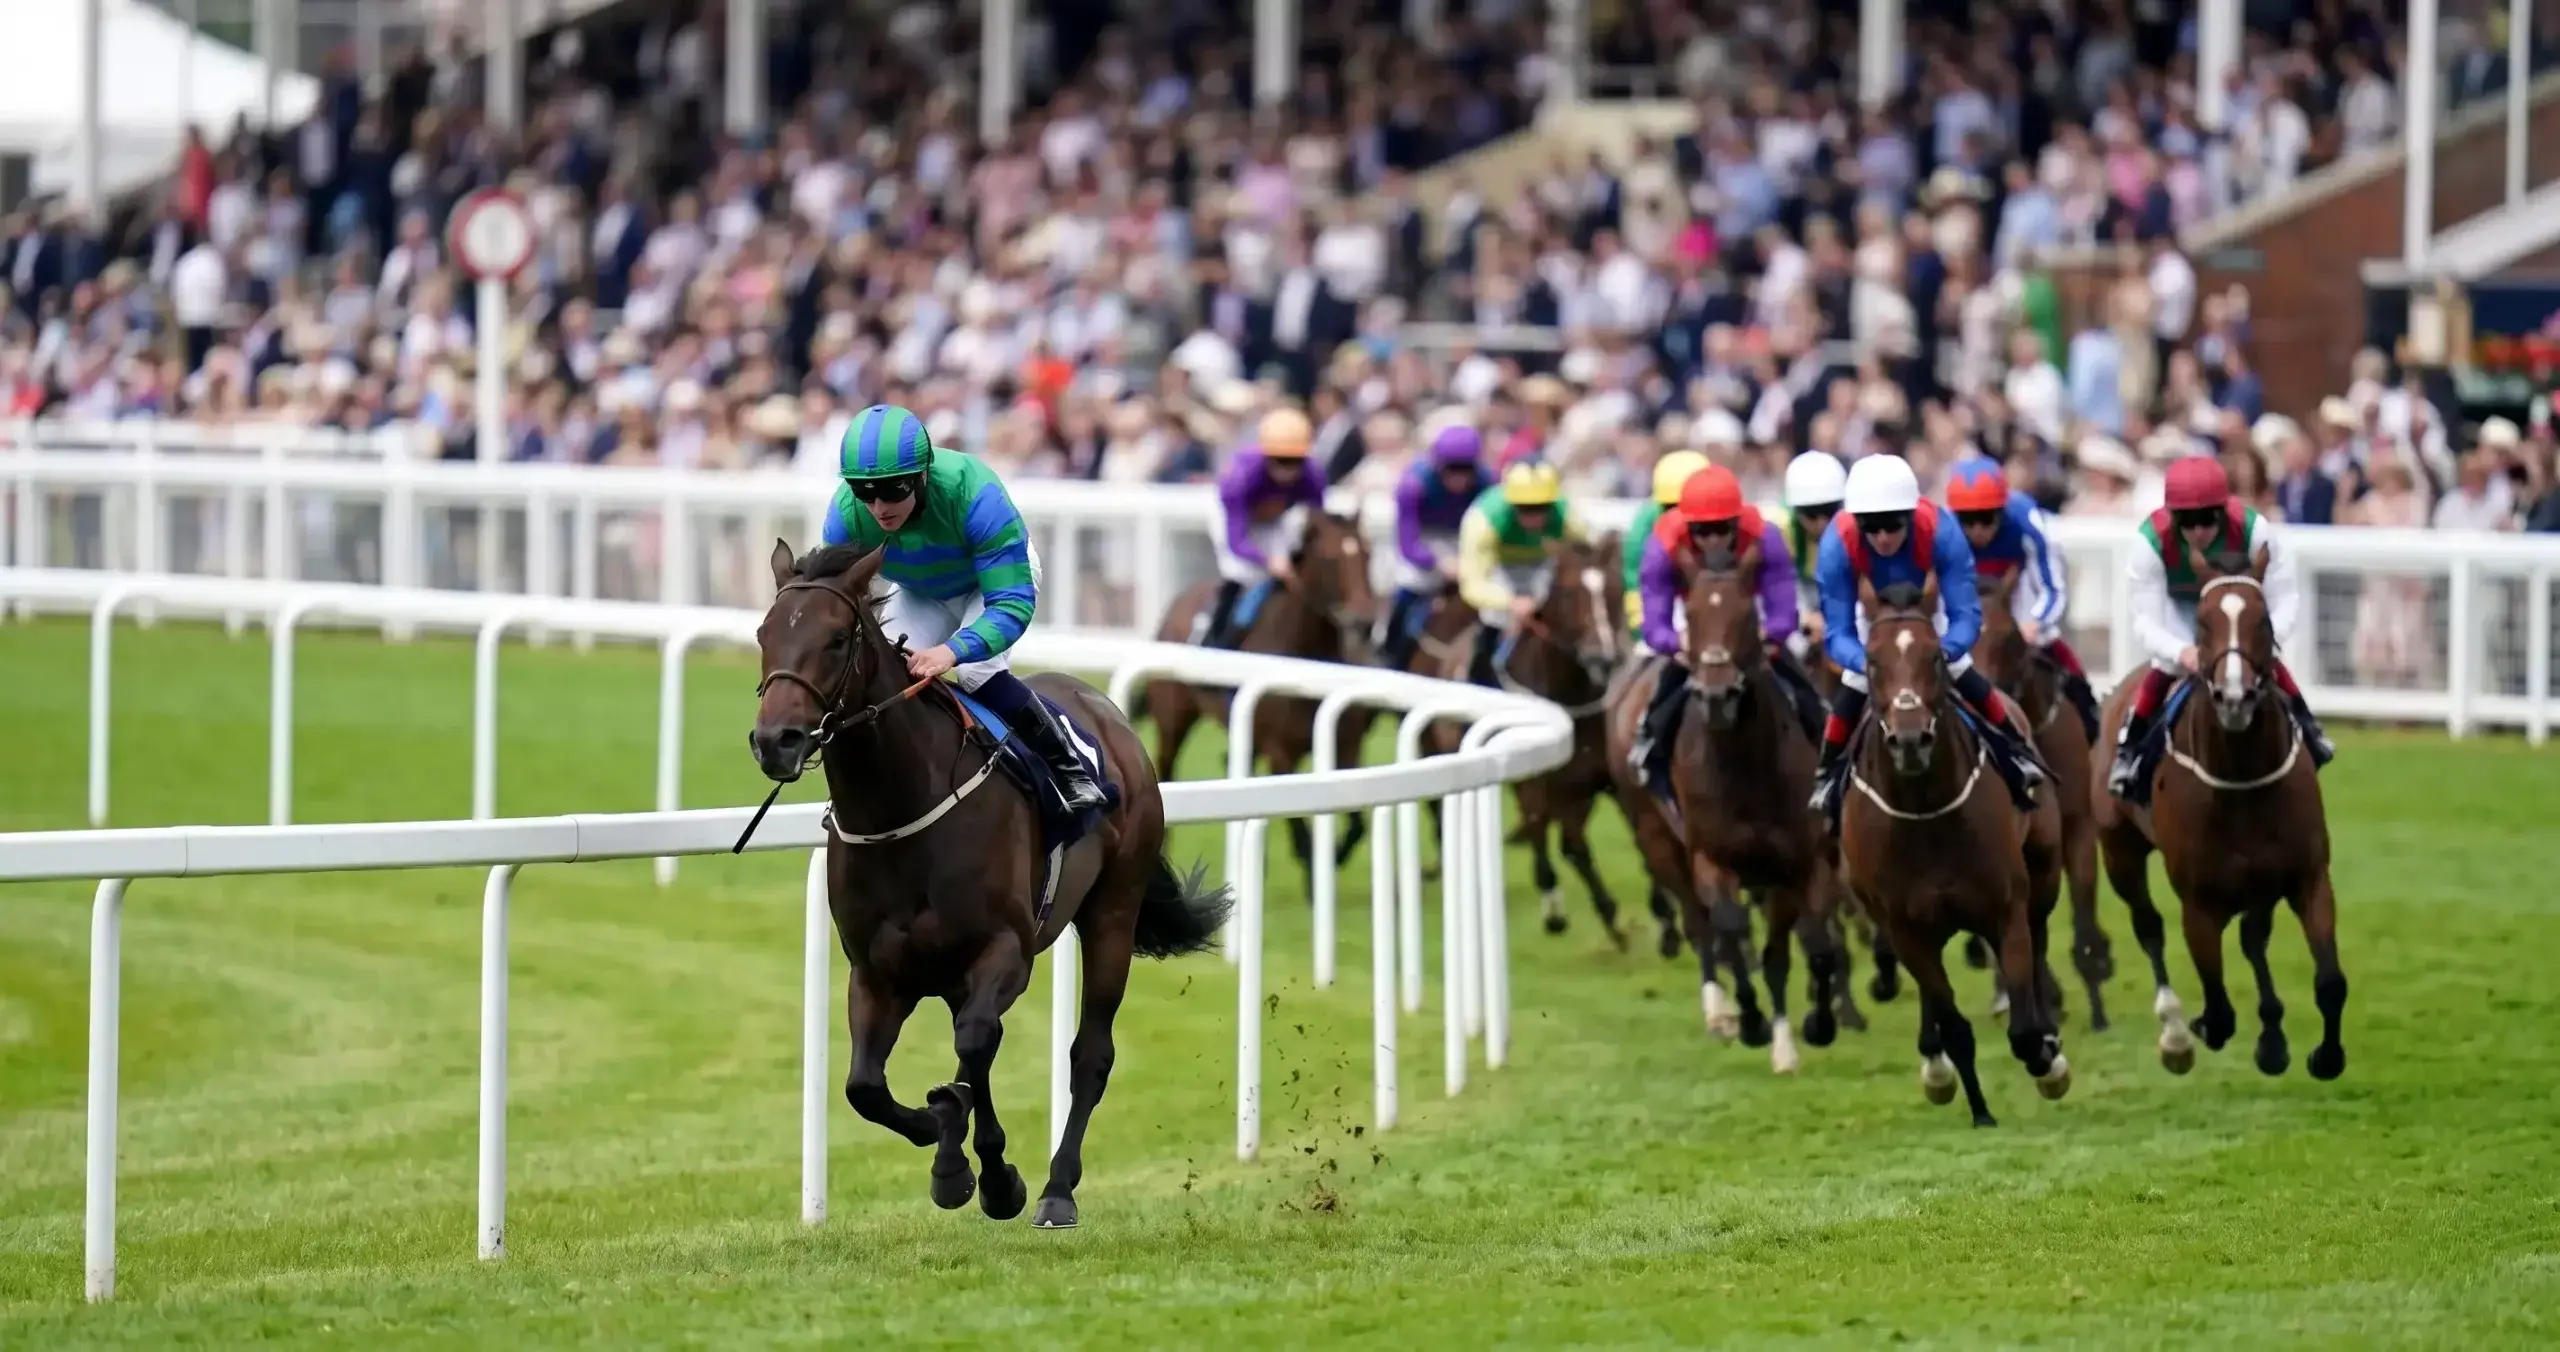
Statistical Breakdown of Market Leader Win Percentages
I hear it at every racecourse I visit. Someone leans over the rail, watches the favourite cruise home, and announces: “See? Just back the favourite every time. Easy money.” It sounds plausible until you run the numbers — and the numbers tell a very different story.
Across all UK race types over the period from 2018 to 2022, the market favourite won approximately 34.4% of all races. That’s barely one in three. The remaining two-thirds of the time, the horse the public collectively decided was most likely to win — got beaten. If you’d blindly backed every favourite at starting price during that period, you’d have made a loss, because bookmakers price favourites below their true odds to reflect the weight of public money flowing onto them.
The “favourites always win” myth persists because confirmation bias is powerful. When the favourite wins, it feels inevitable — you notice it, remember it, and file it under “obvious.” When the favourite loses, it registers as an upset, a fluke, something that went wrong. Over time, the wins loom larger in memory than the losses. The data corrects that illusion.
Overall UK Favourite Win Rate: 34.4% and What It Means
So what does a 34.4% win rate actually mean for a bettor? On its own, it’s not enough information. A 34.4% strike rate is profitable if the average odds are above 2/1 (implied probability 33.3%), and loss-making if the average odds are below that threshold.
In practice, the average SP of UK favourites sits closer to 2/1 or shorter. Odds-on favourites — those priced below evens — win frequently (around 59% on flat turf), but the returns per win are so small that a single loss can wipe out the profit from several winners. A favourite at 4/7 needs to win 63.6% of the time just to break even. At 1/2, the breakeven point is 66.7%. Even at the higher win rates that odds-on horses achieve, the margin is razor-thin and commission or overround erodes it.
Horses at 2/1 or shorter win approximately 50% of UK flat races. That’s an impressive hit rate, but at an average price of, say, 6/4, you need a 40% win rate to break even. The 50% actual win rate looks like a profit — until you account for the bookmaker’s overround, which means you’re rarely getting a true 6/4 on a horse whose fair odds are 6/4.
The takeaway isn’t that favourites are bad bets. It’s that favourites are rarely good-value bets at the prices offered. The market does a reasonable job of identifying the most likely winner — 34.4% is well above random chance in a typical 10-runner field — but the odds offered don’t fully compensate for the 65.6% of the time the favourite loses.
Handicaps, Non-Handicaps, and Jumps: Where Favourites Thrive and Fail
The aggregate 34.4% figure is useful as a baseline, but the strategic value sits in the breakdowns. Different race types produce dramatically different favourite win rates, and understanding these differences shapes everything from laying strategies to staking plans.
Non-handicaps. In conditions races, Group events, maiden races and listed contests, favourites win about 39% of the time. These races have smaller fields (often 6-10 runners), clearer form separations, and less weight-based equalisation. The market’s ability to identify the best horse is strongest here. Backing favourites in non-handicaps at the right price can produce a positive ROI, particularly in two-year-old maidens and novice hurdles where limited race history concentrates the market’s assessment onto one or two obvious candidates.
Handicaps. The picture inverts in handicap races, where the BHA handicapper allocates weight to equalise the field. Favourites win just 25.7% of the time in UK handicaps. That’s roughly one in four. The larger fields (handicaps typically have more runners than conditions races), the weight equalisation, and the complexity of assessing form through the handicap lens all combine to reduce the favourite’s advantage. In large-field handicaps with 16 or more runners — the Cambridgeshire, the Cesarewitch, the big Saturday races at York and Newbury — favourite win rates drop even further.
Jumps racing. Over fences and hurdles, favourites win approximately 30% of all races. The additional uncertainty of jumping — falls, unseating, refusals — introduces a random element that flat racing doesn’t have. A favourite can be the best horse in the race by two stone and still fall at the third flight. This inherent unpredictability makes jumps racing structurally less favourable for favourite backers and structurally more favourable for layers and each-way bettors.
As Skrill’s analysis of betting value notes, a value bet occurs when the odds of an event occurring are greater than the odds assigned by the bookmaker. In non-handicap racing, favourites frequently are the value bet. In handicaps and jumps, they frequently are not — and knowing which category you’re operating in before you place a bet is fundamental to long-term profitability.
What Favourite Statistics Mean for Your Betting Strategy
Every strategy I use starts with the favourite. Not because I back or lay them automatically, but because the favourite’s price anchors the entire market. When the favourite is odds-on, the rest of the field is priced out — the implied probabilities of second and third choices are compressed, and finding value elsewhere becomes harder. When the favourite is 3/1 or bigger, the market opens up, and the probability is distributed more evenly across the field.
For dutching, the favourite’s price determines whether there’s room to cover multiple selections profitably. In a market where the favourite is 4/6, the remaining runners share just 40% of the implied probability pie. In a market where the favourite is 7/2, they share 78%. The second scenario offers far more scope for multi-horse strategies.
For each-way betting, favourite data influences which races offer genuine place value. In handicaps where the favourite wins 25.7% of the time, the top three or four finishers are distributed across a wider range of runners, which means the each-way place part can deliver consistent returns even when the win part misses.
For exchange trading, the favourite’s pre-race price movement is the primary signal. A favourite drifting from 5/2 to 7/2 in the final 30 minutes is shedding support — informed money is moving away. A favourite shortening from 3/1 to 2/1 is absorbing support — someone with information is backing it heavily. Neither signal guarantees the outcome, but both tell you something about how the market’s assessment is shifting in real time.
The 34.4% figure is the starting point, not the destination. What you do with it — which race types you target, which price ranges you engage with, which strategies you deploy — determines whether that statistical reality works for you or against you.